
The national park overcrowding index
The National Park Service recorded 331.9 million recreation visits in 2024, smashing the previous all-time record. That number gets repeated in every travel headline. What doesn't get repeated is the part that matters to anyone planning a trip: where those visitors actually went, and how much space they had when they got there.
Yellowstone drew 4,744,353 visitors last year. Gates of the Arctic drew 11,907. But raw attendance tells you almost nothing about how crowded a park feels on the ground. Yellowstone spans 2.2 million acres. Bryce Canyon covers 35,835. A park's size, its visitor count, and the month you show up together determine whether you're walking a peaceful trail or standing in a parking lot queue at 7 a.m.
Outwander.com built an overcrowding index for all 63 national parks to answer the only question that matters for trip planning: When should you actually go?
How the Index Works
The formula is simple. For each park, for each month, this was calculated:
Peak-Month Density = Actual Peak-Month Visitors ÷ Park Acreage
Peak-month visitor counts come from the NPS IRMA Stats, which provides actual 2024 monthly recreation visit counts for all national parks.
All 63 parks were ranked by their peak-month density score, grouped into four tiers, and flagged for visitation increase of more than 20% compared to 2019, the last full pre-COVID-19 pandemic year.
The tiers:
- Critical Overcrowding (6 parks): Density above 5.0 visitors per acre in peak month
- High Traffic (19 parks): Density between 1.0 and 5.0
- Moderate (21 parks): Density between 0.3 and 1.0
- Under the Radar (17 parks): Density below 0.3
The Rankings Aren't What You'd Expect
The most visited park in America, Great Smoky Mountains (12,191,834 visitors), ranks 10th for crowding. Its 522,419 acres absorb those numbers better than you'd think.
Yellowstone? It lands at 41st. Grand Canyon sits at 40th. Yosemite is 32nd.
The parks topping the density rankings are the ones nobody puts on "most crowded" lists, because journalists usually just sort by total attendance. Here's what the data says instead.
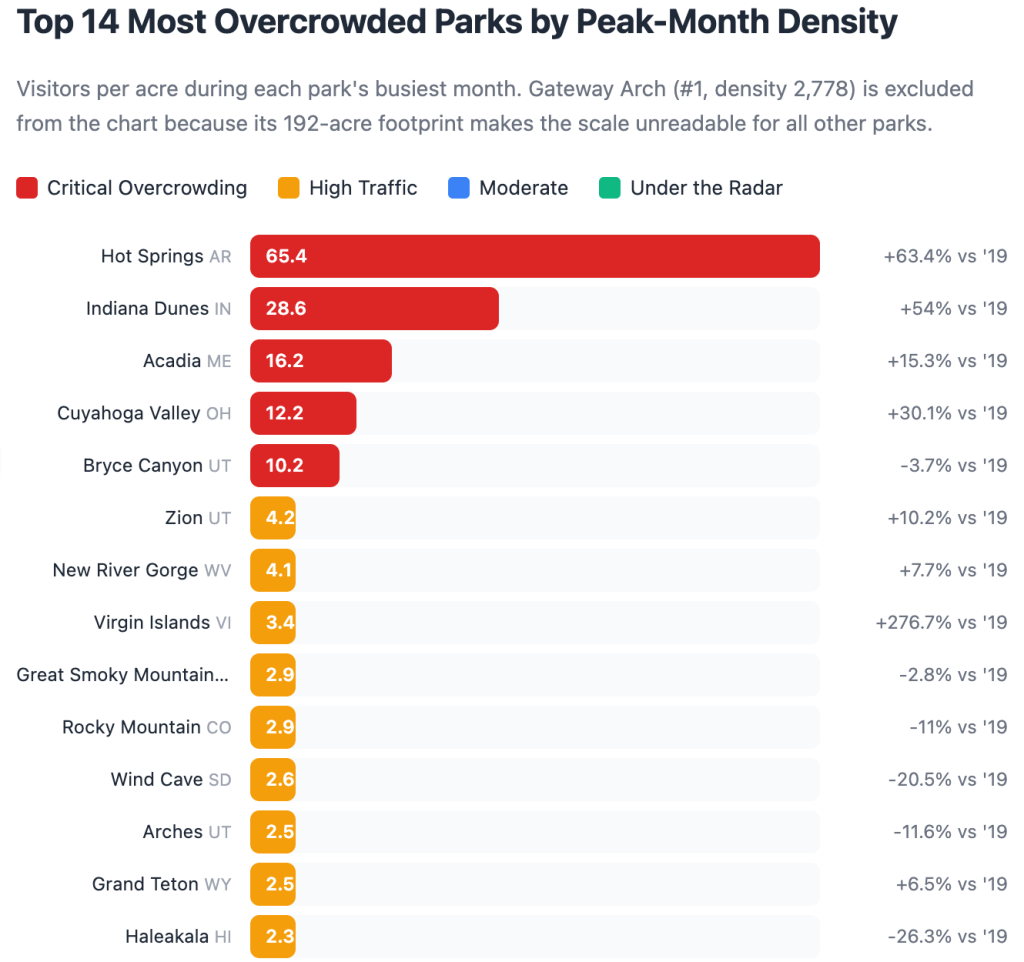
The 6 Most Overcrowded Parks Per Square Foot
1. Gateway Arch, Missouri: 2,777.6 visitors/acre in July
At 192 acres, Gateway Arch is the smallest national park and draws 2,563,052 visitors a year. Those visitors funnel into an area smaller than a midsize shopping mall's parking lot. The density score is orders of magnitude beyond any other park. It's effectively a single-attraction urban monument. Visitation has climbed 24.7% since 2019.
2. Hot Springs, Arkansas: 65.4 visitors/acre in June
Hot Springs packs 2,461,812 visitors into 5,550 acres, and visitation has surged 63.4% since 2019. Most visitors cluster around Bathhouse Row and the thermal springs on Central Avenue, meaning the functional crowding is far worse than even this number suggests. The peak shifts to June rather than the traditional October peak. Best window: January and February, when traffic drops by roughly half.
3. Indiana Dunes, Indiana: 28.6 visitors/acre in June
The newest entry in the national park system (redesignated from a national lakeshore in 2019) has grown from 1,756,079 visitors in 2019 to 2,705,209 in 2024, a 54.0% increase. At just 16,000 acres along Lake Michigan's southern shore, it's the fastest-accelerating overcrowding story in the system. Peak month moved to June. Best window: weekdays in September.
4. Acadia, Maine: 16.2 visitors/acre in August
Acadia's 49,075 acres on Mount Desert Island hosted 3,961,661 visitors in 2024. August is the worst month. The park implemented a timed-entry reservation system for Cadillac Summit Road starting in 2021, which has helped somewhat, but parking lots on the Park Loop Road still fill by 9 a.m. in July and August. Best window: the second and third weeks of September. Crowds thin fast after Labor Day, and the foliage hasn't peaked yet.
5. Cuyahoga Valley, Ohio: 12.2 visitors/acre in July
A small, urban-adjacent park at 32,783 acres between Cleveland and Akron, Cuyahoga pulls 2,912,454 visitors who come for the Towpath Trail and Brandywine Falls. Visitation is up 30.1% over 2019. Best window: late October through November, when fall color draws a crowd but not a crush.
6. Bryce Canyon, Utah: 10.2 visitors/acre in September
At 35,835 acres, Bryce is the second-smallest park in Utah's "Mighty Five." It drew 2,498,075 visitors in 2024. Peak visitation shifted from summer to September. The park draws most visitors to Sunrise, Sunset, and Inspiration Points. Best window: late April or early October, when temps are pleasant and the hoodoos aren't ringed by tour buses.
The Swap List: Less Crowded Alternatives
If your first-choice park falls in the critical or high-traffic tiers, there's often a lower-density alternative within driving distance that offers a similar landscape.
Planning a trip to Zion (ranked 7th, 4.2 visitors/acre in June)? Drive three hours east to Capitol Reef (ranked 27th, 0.87 visitors/acre). Capitol Reef has the same red-rock canyon scenery, fewer restrictions, and free dispersed camping along the Burr Trail. Its visitor count has climbed 16% since 2019, but the park's 241,904 acres keep density manageable.
Arches (ranked 13th) now requires a timed-entry reservation during peak season. Skip the hassle and head south to Canyonlands (ranked 43rd, 0.36 visitors/acre). The Island in the Sky district sits just 30 minutes from Moab and offers views that rival anything at Arches, without the reservation lottery.
If Acadia (ranked 4th) in August sounds like a traffic jam, look at Voyageurs (ranked 48th, 0.22 visitors/acre) in northern Minnesota. Different ecosystem, obviously, but Voyageurs offers kayaking, island camping, and northern lights without fighting for a parking spot.
For anyone considering the Great Smoky Mountains (ranked 10th, 2.9 visitors/acre in October), nearby Congaree (ranked 24th) in South Carolina gets a fraction of the foot traffic. It's the largest intact expanse of old-growth bottomland hardwood forest in North America, and most visitors never wade past the boardwalk. Visitation has jumped 51.8% since 2019, but the 27,187 acres still provide breathing room. Best time: spring, when the synchronous fireflies put on their annual show.
The ‘Celebrity Parks’ Are Less Crowded Than You Think
The density index produces some genuinely counterintuitive results. Yellowstone, often held up as the poster child for national park overcrowding, ranks 41st on a per-acre basis, below Mammoth Cave (ranked 17th), Wind Cave (ranked 12th), and Carlsbad Caverns (ranked 25th). Grand Canyon's massive footprint (1,201,647 acres) dilutes its 4,919,163 visitors into a moderate density score of 0.46 visitors/acre in its peak month of May, ranking it 40th.
This doesn't mean these parks feel empty. Yellowstone's 4,744,353 visitors still pack Old Faithful boardwalks and clog the Grand Loop Road in July. But the bottleneck in those parks is infrastructure, not raw land area. The crowds concentrate at developed viewpoints and road corridors. Backcountry permits in Yellowstone often go unused, even in peak season.
For trip planning, the implication is clear: If you're willing to hike more than a mile from a parking lot, the "famous" parks offer more elbow room than their reputations suggest.
13 Parks Are Accelerating
Every park where 2024 attendance exceeded 2019 levels by more than 20% was flagged. Thirteen parks cleared that bar, and the growth rates tell a story about shifting visitor patterns.
American Samoa leads the list at +289.0%, though that's growth from a tiny base (5,802 visitors to 22,567). Virgin Islands jumped 276.7%, likely reflecting a post-hurricane and post-pandemic rebound. Indiana Dunes at +54.0% is the most operationally significant surge: The "national park" designation, combined with proximity to Chicago, has reshaped this park's visitor profile.
Other accelerating parks: Hot Springs (+63.4%), Congaree (+51.8%), Mammoth Cave (+40.1%), Cuyahoga Valley (+30.1%), Pinnacles (+26.0%), Gateway Arch (+24.7%), Kings Canyon (+24.2%), Big Bend (+21.0%), Redwood (+20.9%), and Shenandoah (+20.7%).
A pattern emerges: Many of the accelerating parks are lesser-known, smaller, and closer to metro areas. The overcrowding problem is spreading from the iconic parks to the system's second tier. And unlike Yellowstone or Grand Canyon, which have decades of infrastructure investment, these parks often lack the parking, trail capacity, and ranger staffing to absorb the growth.
Indiana Dunes is the clearest warning signal. A park that was relatively quiet as a "national lakeshore" saw its attendance double within five years of redesignation. The NPS didn't double its budget or staff. The 15 miles of Lake Michigan shoreline now absorb a visitor load comparable to Yosemite's, on a fraction of the acreage.
When to Go: Month-by-Month Cheat Sheet
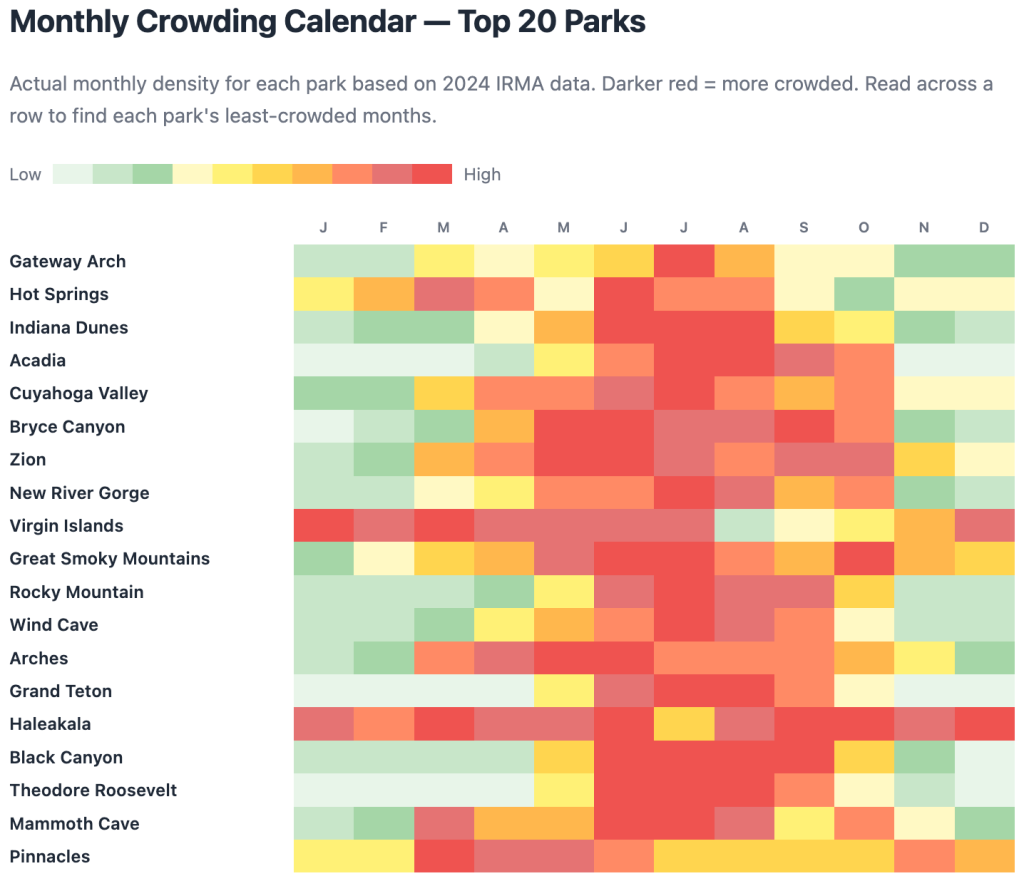
The best time to visit any national park is the month when you get the most favorable weather-to-crowd ratio. Here are the high-value windows for the top 15 densest parks:
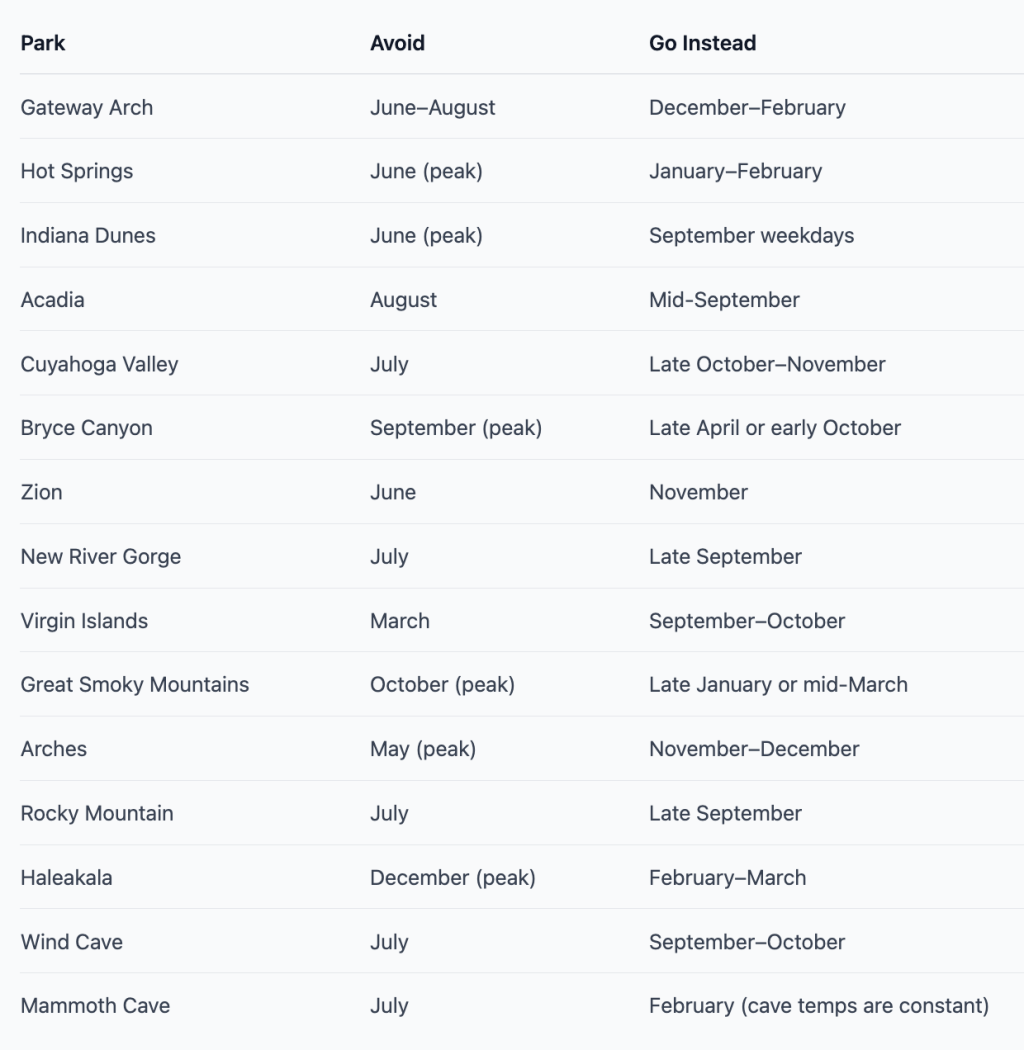
Mammoth Cave is a special case. The cave itself stays 54°F year-round. Going in February means you get the exact same underground experience with a fraction of the surface-level crowds.
Two broader rules of thumb for any park not listed above: First, the week after Labor Day and the week before Memorial Day are almost always the best shoulder windows in the entire system. Second, Tuesday through Thursday visits consistently run 25%-40% below weekend traffic at parks where NPS tracks daily counts. If you have flexibility on the day of the week, that alone can shift your experience from "crowded" to "comfortable."
Methodology and Data Sources
Visitor data: 2024 and 2019 annual recreation visit counts and actual monthly data from the NPS IRMA Stats REST API. All monthly visitor counts are verified actual values, not estimates. Recreation visits count entries to a park, not unique visitors.
Acreage: Official gross acreage from NPS land resources reports, cross-referenced with individual park pages.
Peak-month data: Based on actual 2024 monthly recreation visit counts from the NPS IRMA database. Each park's peak month represents the calendar month with the highest visitation.
Tier thresholds: Set by natural breaks in the density distribution. "Critical Overcrowding" (>5.0 visitors/acre/peak-month) captures six parks with clearly elevated densities. Thresholds are not based on any official NPS capacity standard, because NPS does not publish system-wide capacity targets.
Limitations: Acreage represents gross park area, not accessible or developed area. Visitors concentrate in front-country zones, meaning true crowding at popular viewpoints and trailheads is far higher than park-wide averages suggest.
This story was produced by outwander.com and reviewed and distributed by Stacker.


