Counties with the most bridges in dire need of repair in Washington

·Stacker

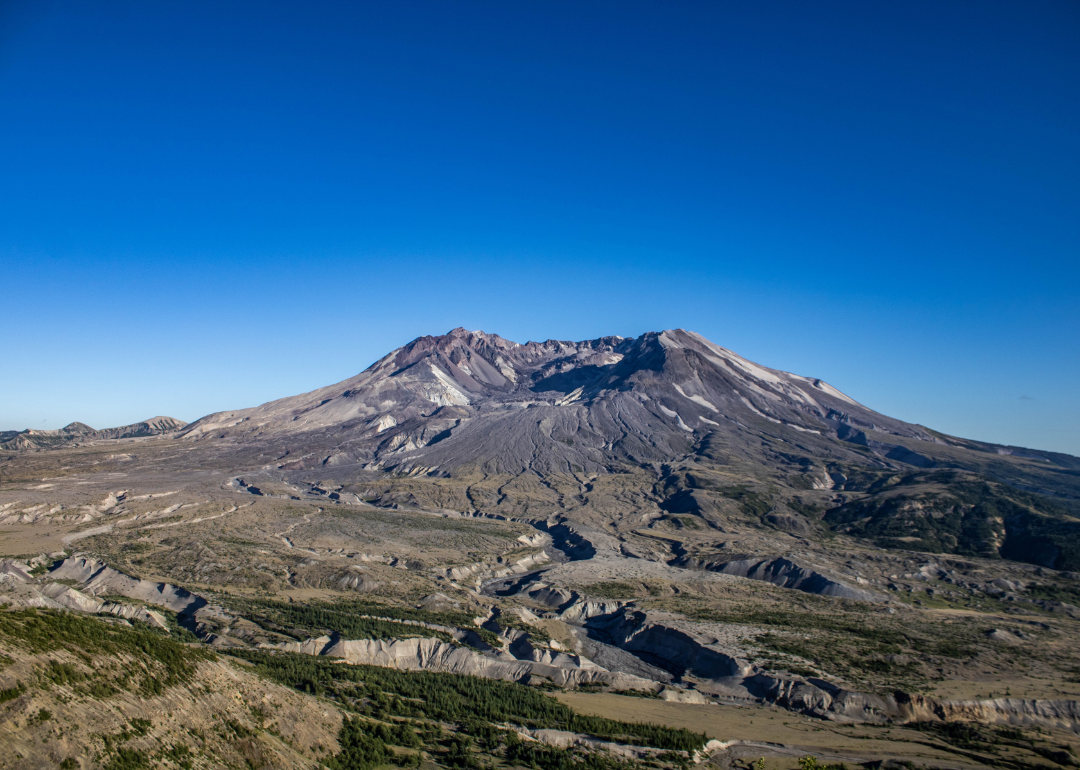
kathmanduphotog // Shutterstock

One in three U.S. bridges is in need of repair or replacement, according to data from the American Road & Transportation Builders Association, including 29% of interstate bridges. The cost to make these repairs is estimated to be in excess of $54 billion.

Stacker investigated which counties in Washington have the most bridges in dire need of repair using data from the Federal Highway Administration. The data is accurate as of June 15, 2022. Counties are ranked by percent of bridges in "poor" condition and ties are broken by percent square meters of bridges in poor condition. Counties that have no bridges or have no bridges in poor condition are excluded from the list.

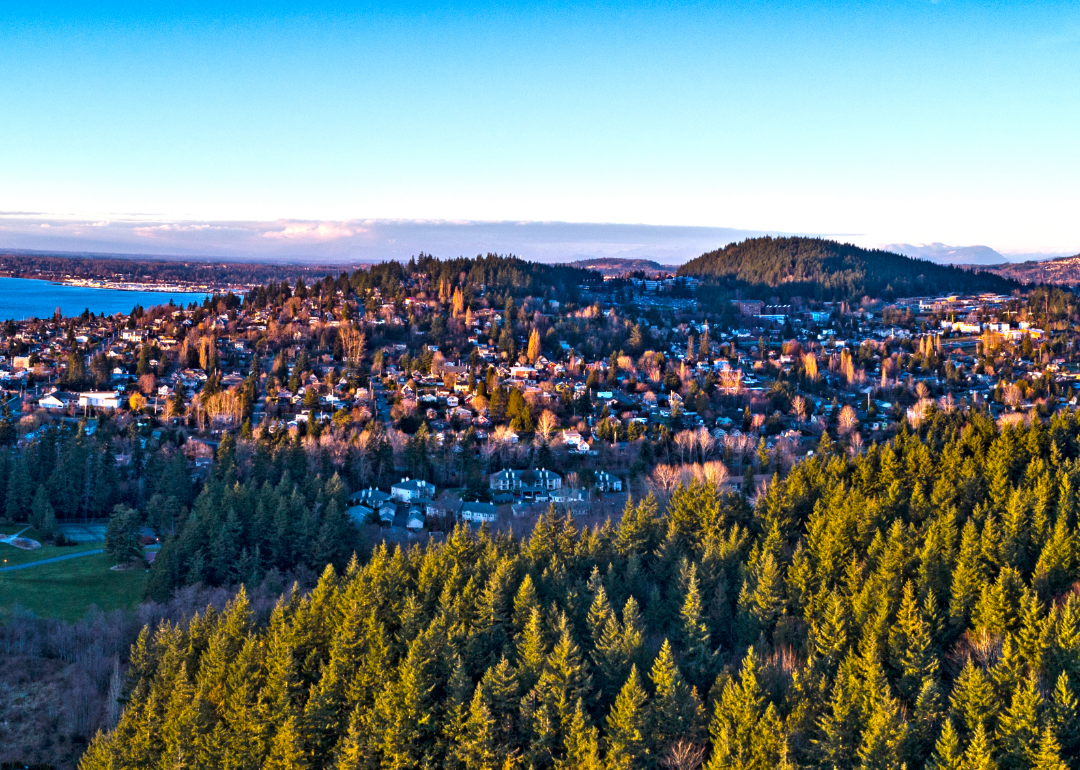
#20. Whatcom County

Canva

1 / 20

#20. Whatcom County

- Bridges in poor condition: 5.2% (18 of 348 bridges)
- Square meters of bridges in poor condition: 3.1% (4,565 of 146,740 square meters of bridges)

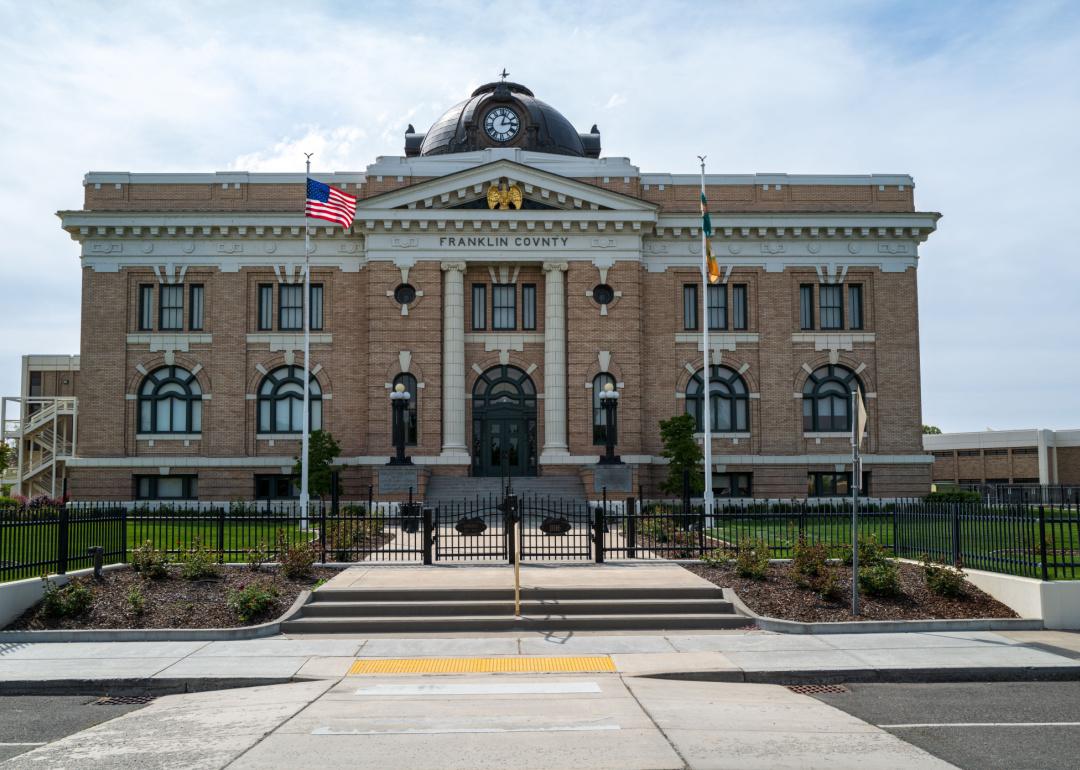
#19. Franklin County

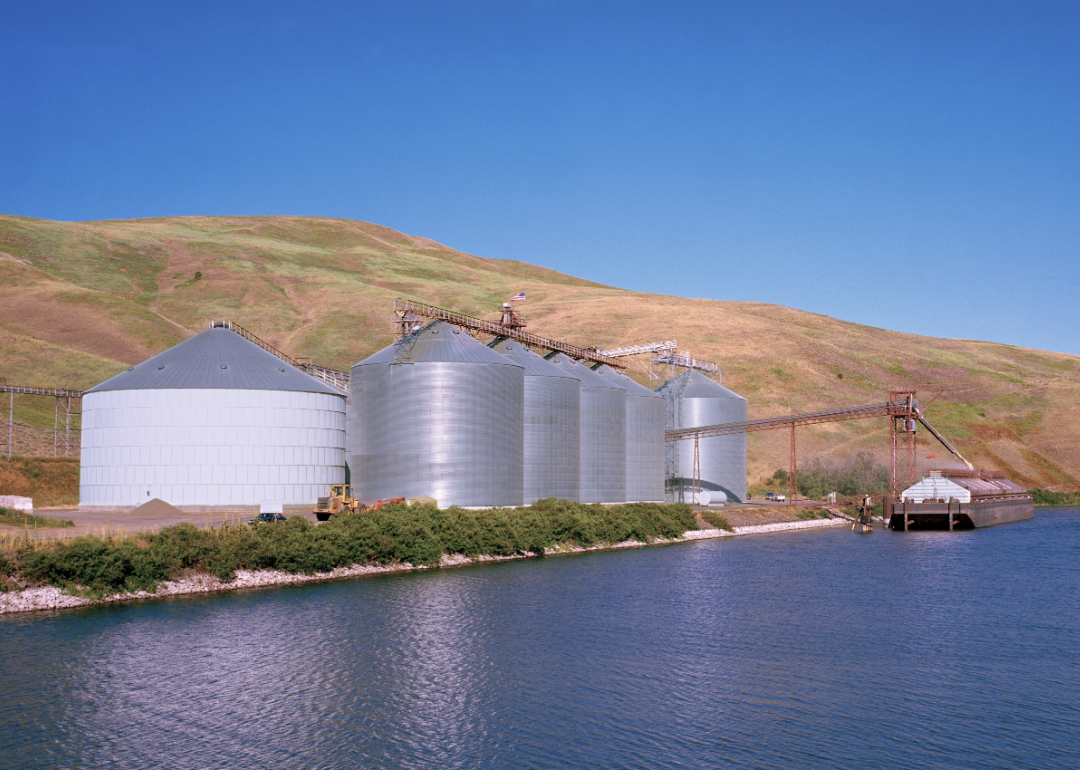
davidrh // Shutterstock

2 / 20

#19. Franklin County

- Bridges in poor condition: 5.2% (7 of 134 bridges)
- Square meters of bridges in poor condition: 2.8% (1,710 of 61,055 square meters of bridges)

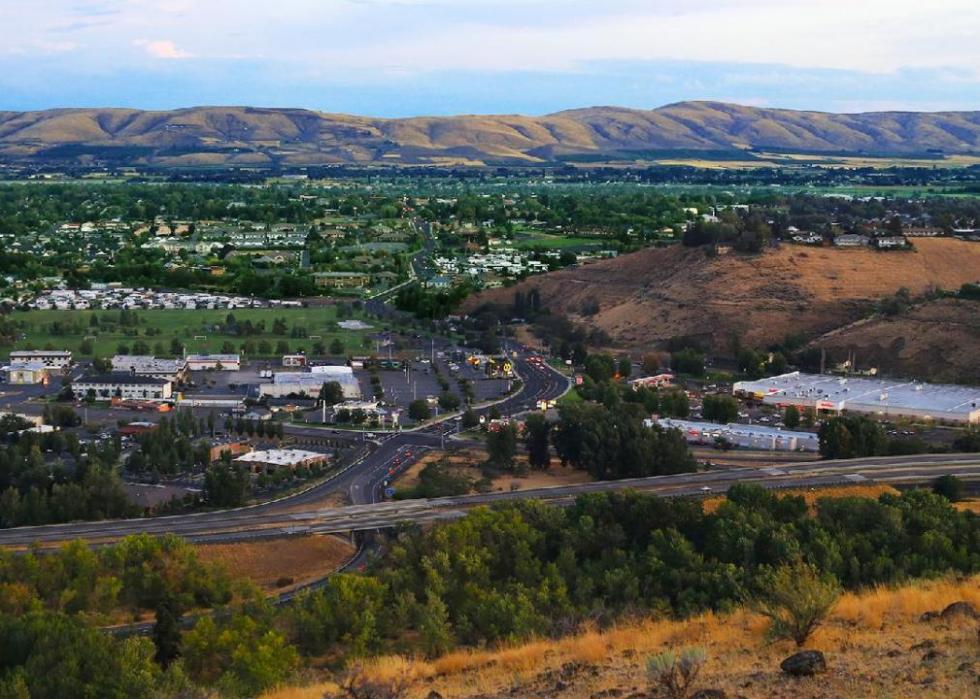
#18. Yakima County

Canva

3 / 20

#18. Yakima County

- Bridges in poor condition: 5.3% (29 of 551 bridges)
- Square meters of bridges in poor condition: 13.1% (32,694 of 249,546 square meters of bridges)

#17. Okanogan County

Canva

4 / 20

#17. Okanogan County

- Bridges in poor condition: 5.8% (9 of 154 bridges)
- Square meters of bridges in poor condition: 12.2% (6,541 of 53,572 square meters of bridges)

#16. Clallam County

Canva

5 / 20

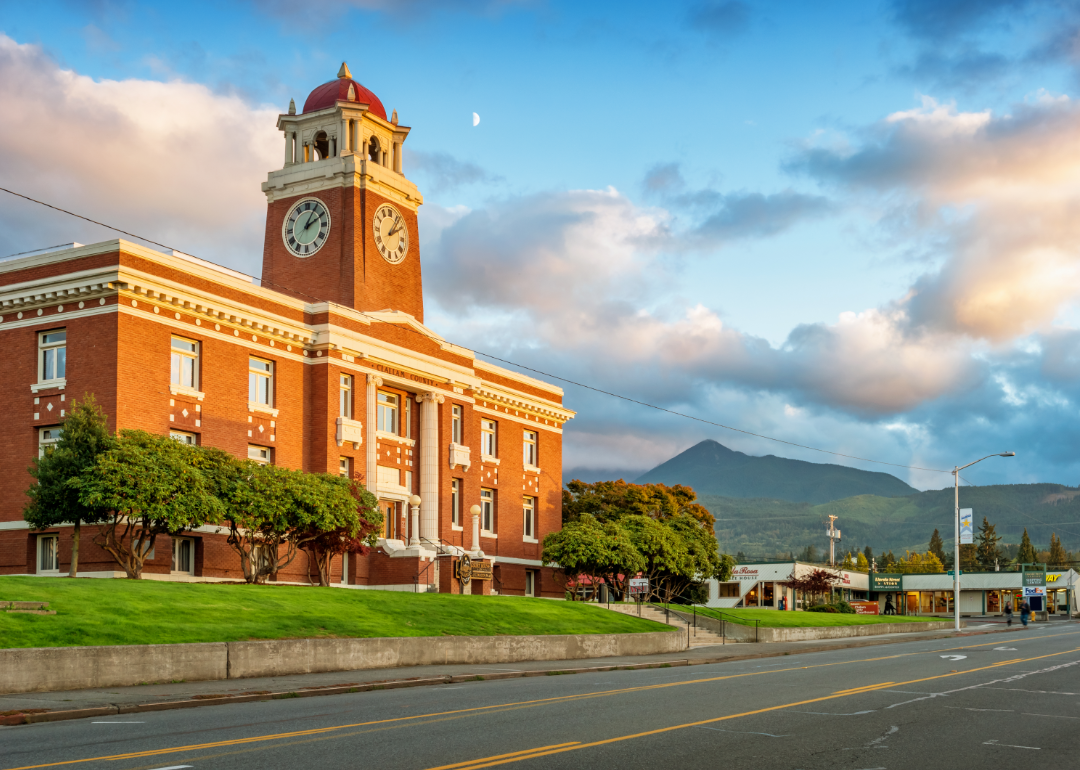
#16. Clallam County

- Bridges in poor condition: 6.2% (9 of 146 bridges)
- Square meters of bridges in poor condition: 5.4% (3,927 of 72,718 square meters of bridges)

#15. Chelan County

Canva

6 / 20

#15. Chelan County

- Bridges in poor condition: 6.3% (9 of 142 bridges)
- Square meters of bridges in poor condition: 23.5% (17,098 of 72,688 square meters of bridges)

#14. Adams County

Arpad Jasko // Shutterstock

7 / 20

#14. Adams County

- Bridges in poor condition: 6.4% (12 of 188 bridges)
- Square meters of bridges in poor condition: 13.2% (7,417 of 56,276 square meters of bridges)

#13. Lincoln County

Arpad Jasko // Shutterstock

8 / 20

#13. Lincoln County

- Bridges in poor condition: 7.3% (13 of 179 bridges)
- Square meters of bridges in poor condition: 4.8% (1,768 of 36,690 square meters of bridges)

#12. Skamania County

Canva

9 / 20

#12. Skamania County

- Bridges in poor condition: 7.5% (9 of 120 bridges)
- Square meters of bridges in poor condition: 5.4% (2,280 of 42,226 square meters of bridges)

#11. Garfield County

Canva

10 / 20

#11. Garfield County

- Bridges in poor condition: 7.5% (4 of 53 bridges)
- Square meters of bridges in poor condition: 37.3% (6,099 of 16,340 square meters of bridges)

#10. Grays Harbor County

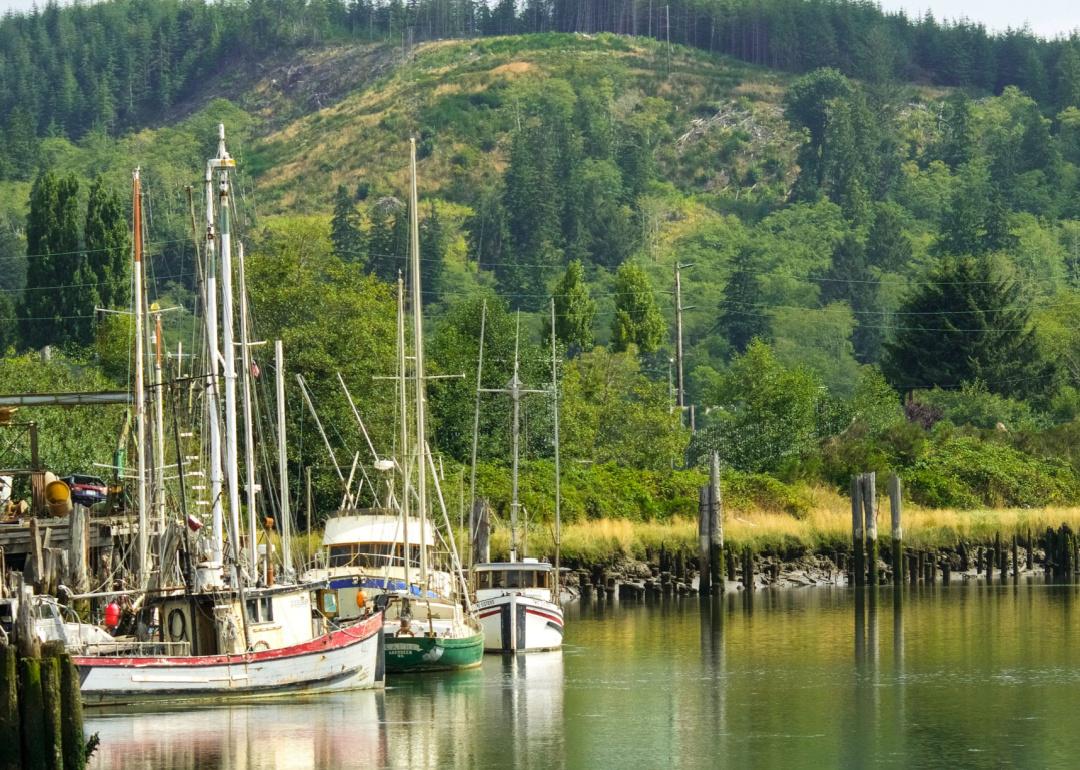
seesaw1 // Shutterstock

11 / 20

#10. Grays Harbor County

- Bridges in poor condition: 8.1% (29 of 358 bridges)
- Square meters of bridges in poor condition: 16.3% (31,427 of 192,336 square meters of bridges)
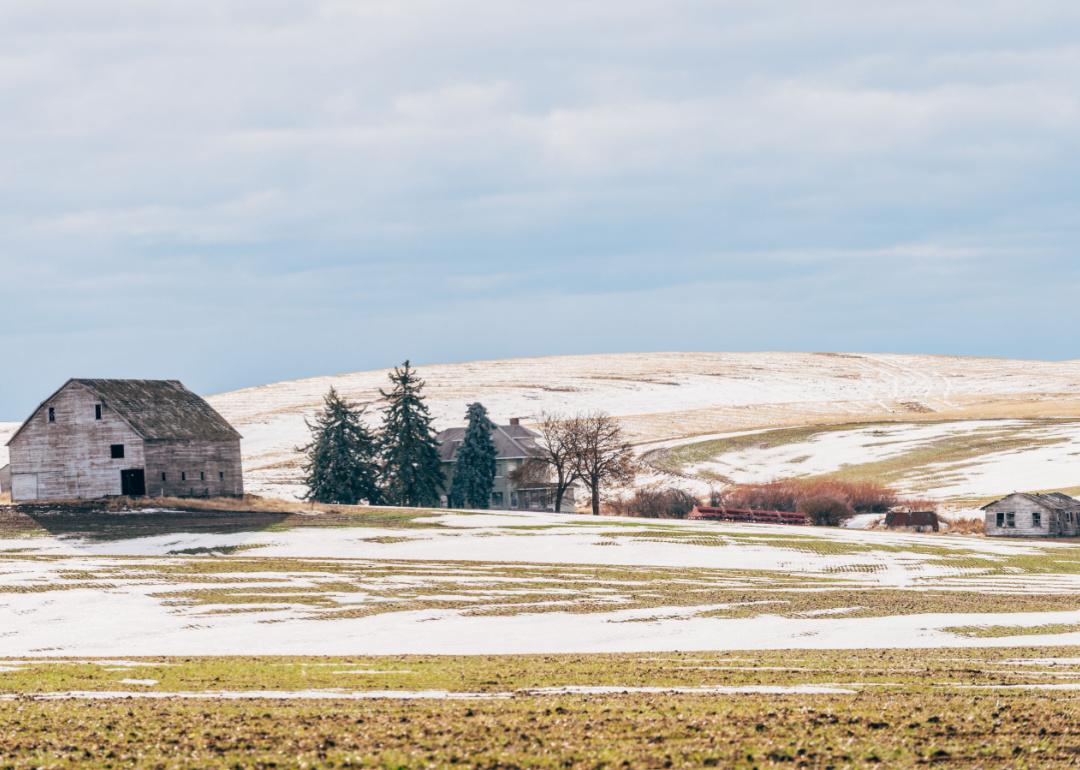
#9. Klickitat County

Canva

12 / 20

#9. Klickitat County

- Bridges in poor condition: 8.2% (8 of 97 bridges)
- Square meters of bridges in poor condition: 23.8% (12,440 of 52,233 square meters of bridges)
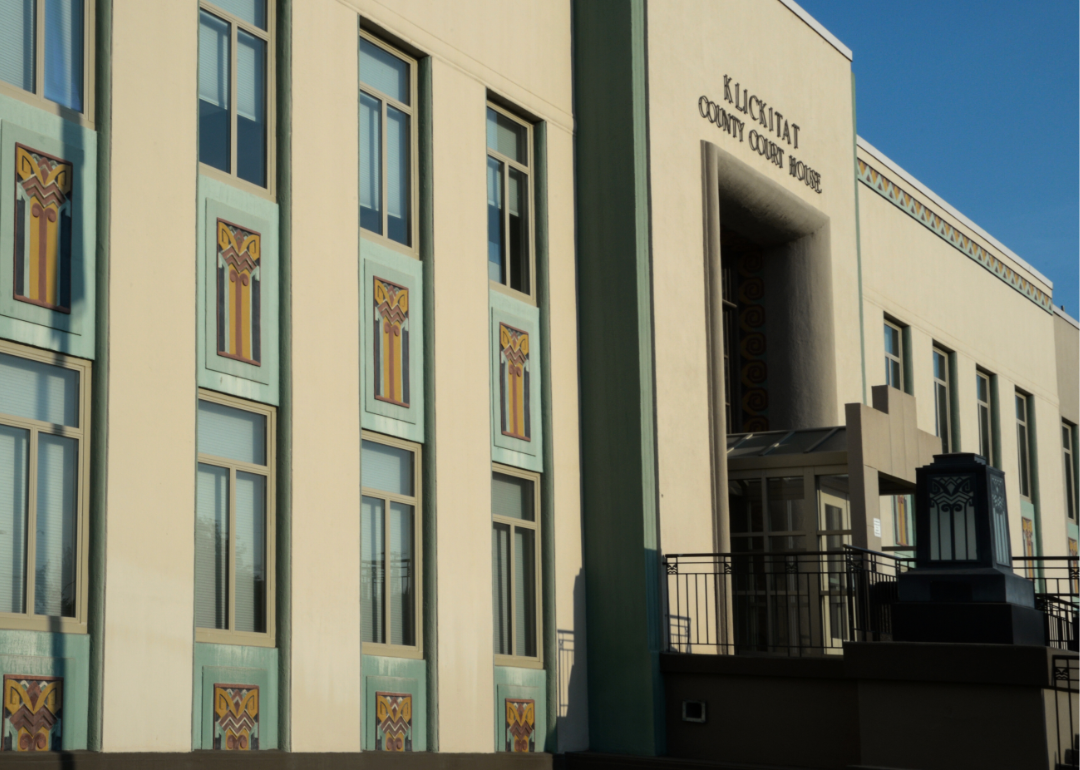
#8. Spokane County

Canva

13 / 20

#8. Spokane County

- Bridges in poor condition: 8.5% (26 of 305 bridges)
- Square meters of bridges in poor condition: 13.0% (43,362 of 334,199 square meters of bridges)
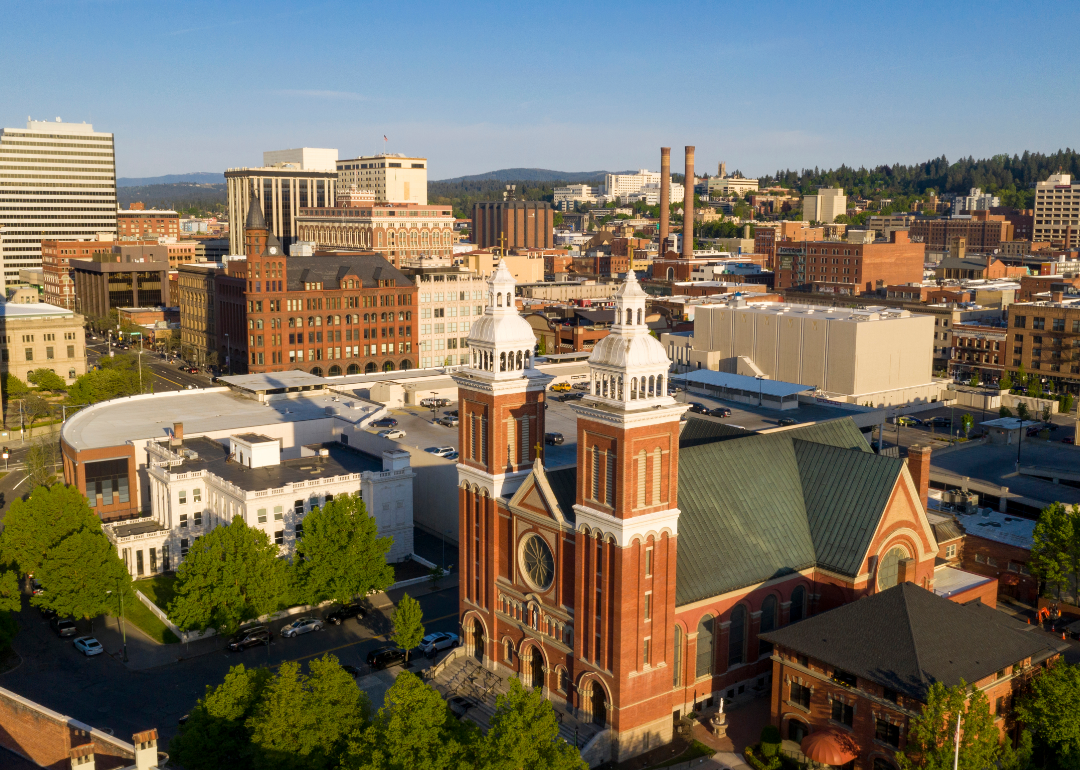
#7. Columbia County

davidrh // Shutterstock

14 / 20

#7. Columbia County

- Bridges in poor condition: 9.3% (8 of 86 bridges)
- Square meters of bridges in poor condition: 11.5% (2,510 of 21,823 square meters of bridges)
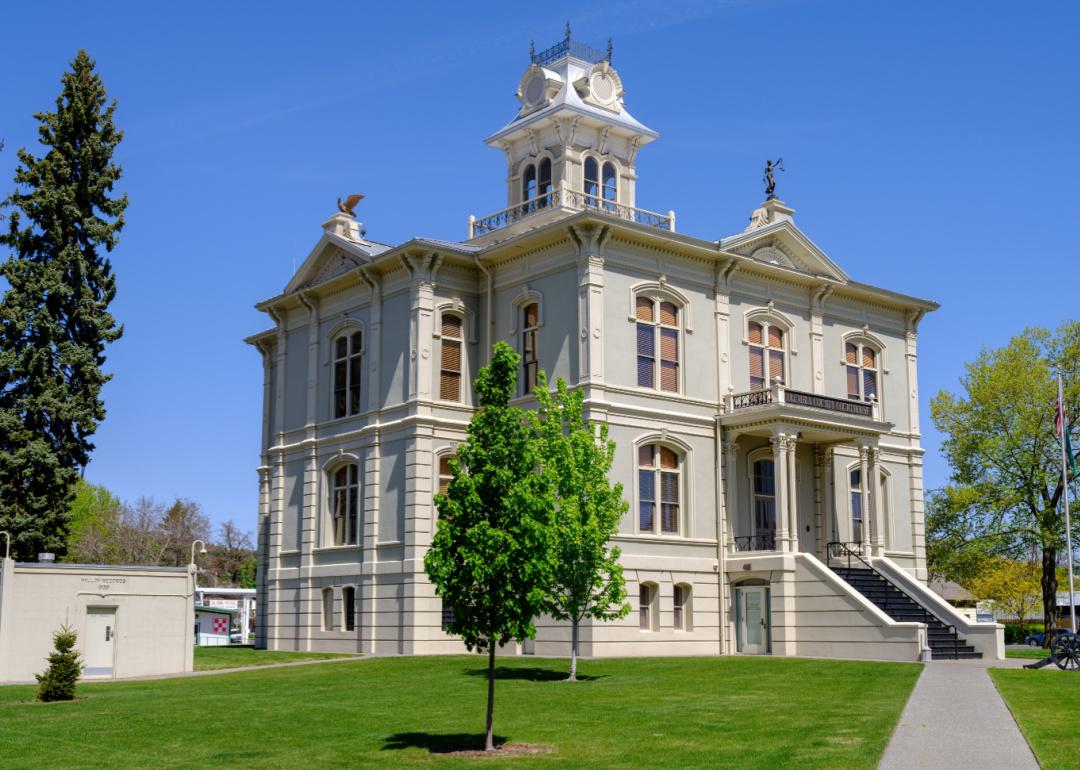
#6. Douglas County

Canva

15 / 20

#6. Douglas County

- Bridges in poor condition: 10.0% (4 of 40 bridges)
- Square meters of bridges in poor condition: 10.5% (3,919 of 37,455 square meters of bridges)
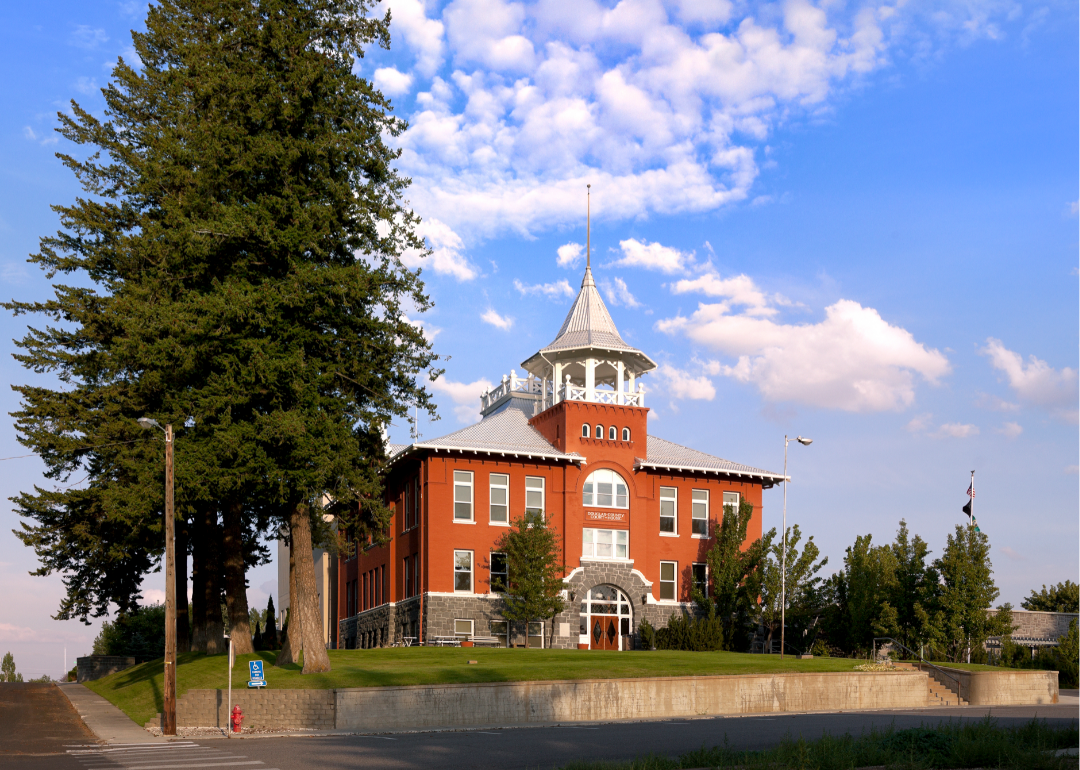
#5. Walla Walla County

Canva

16 / 20

#5. Walla Walla County

- Bridges in poor condition: 10.4% (19 of 182 bridges)
- Square meters of bridges in poor condition: 8.2% (6,108 of 74,908 square meters of bridges)
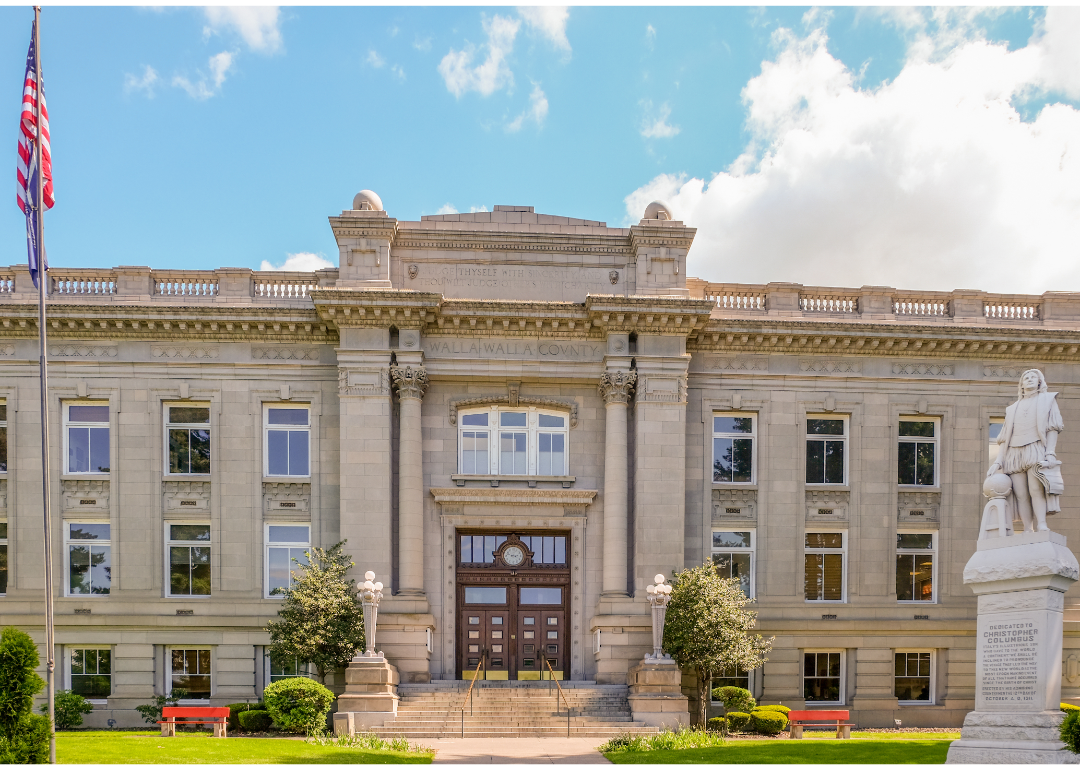
#4. Kittitas County

Canva

17 / 20

#4. Kittitas County

- Bridges in poor condition: 12.5% (39 of 311 bridges)
- Square meters of bridges in poor condition: 15.2% (24,865 of 163,842 square meters of bridges)
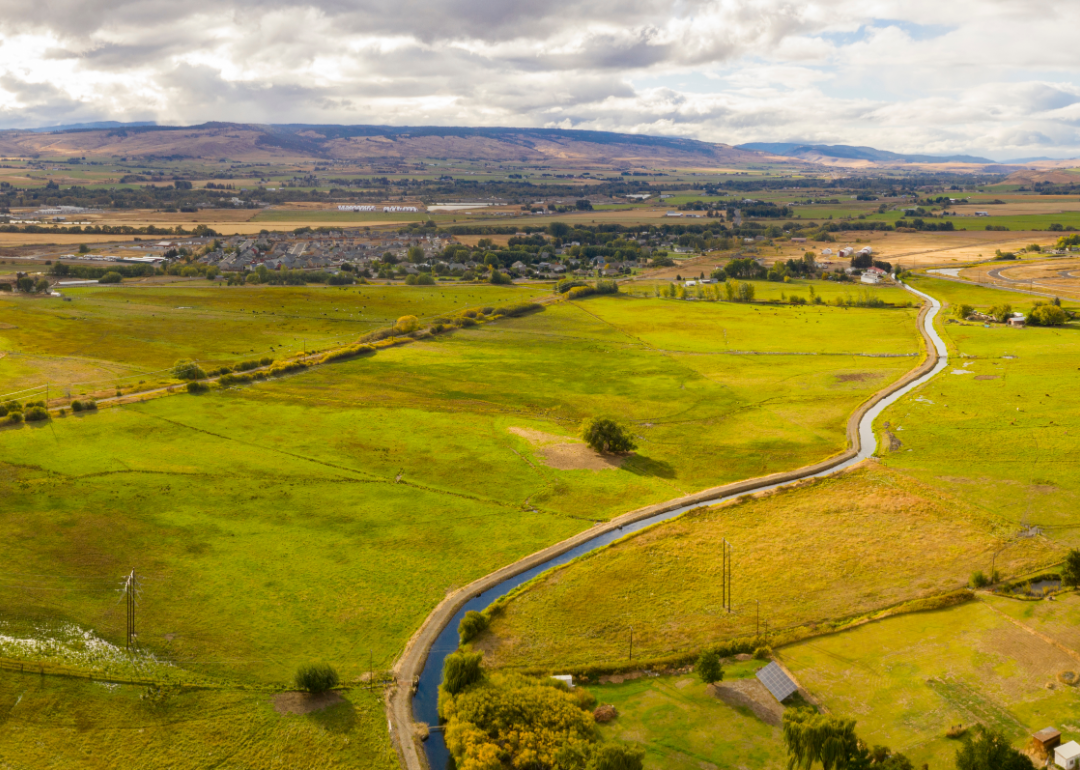
#3. Pend Oreille County

Canva

18 / 20

#3. Pend Oreille County

- Bridges in poor condition: 12.7% (9 of 71 bridges)
- Square meters of bridges in poor condition: 4.8% (1,063 of 22,319 square meters of bridges)
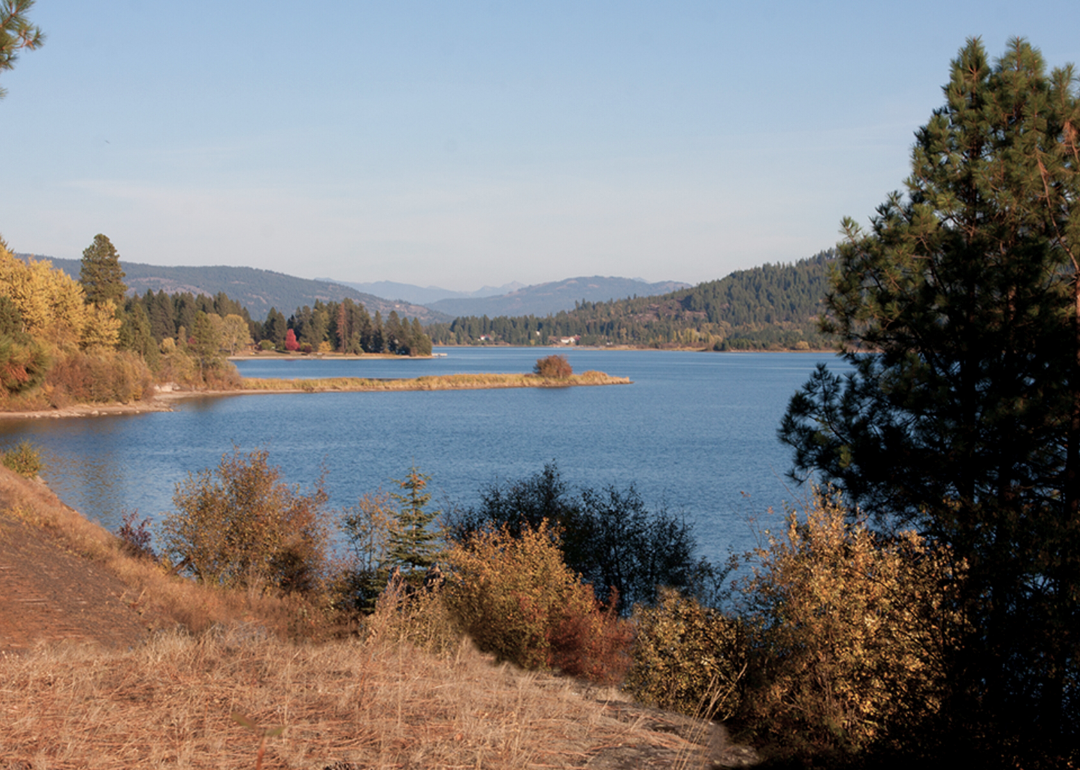
#2. Stevens County

Canva

19 / 20

#2. Stevens County

- Bridges in poor condition: 12.7% (9 of 71 bridges)
- Square meters of bridges in poor condition: 22.5% (5,316 of 23,631 square meters of bridges)
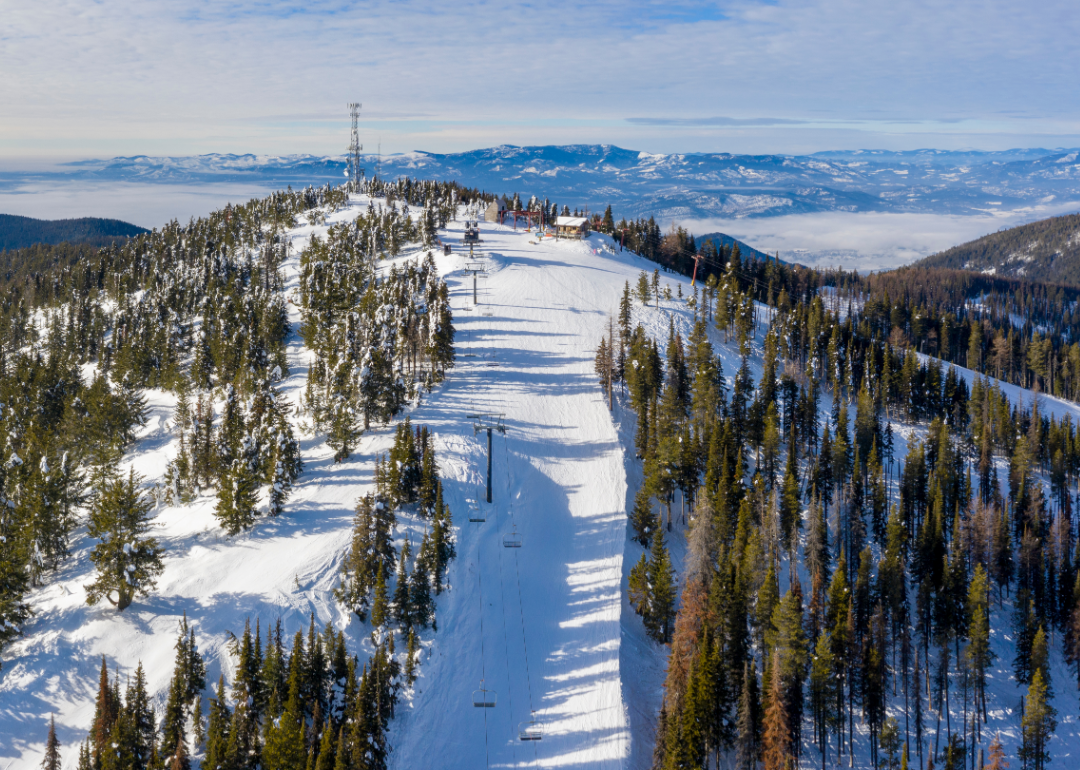
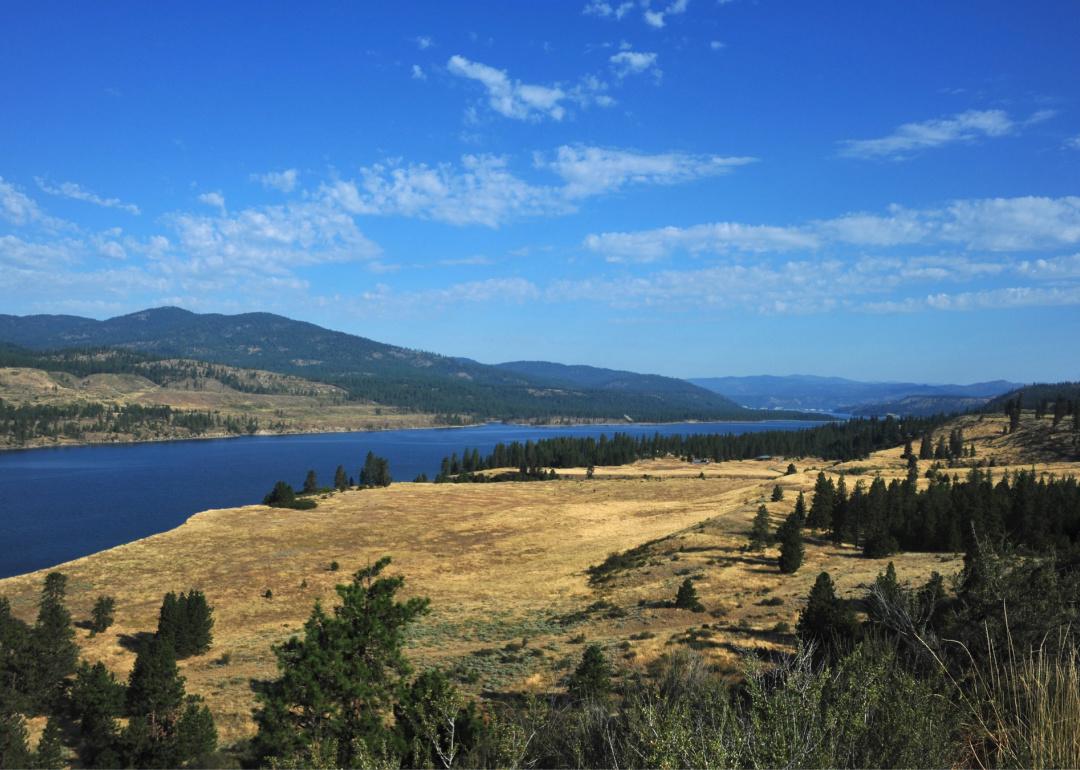
#1. Ferry County

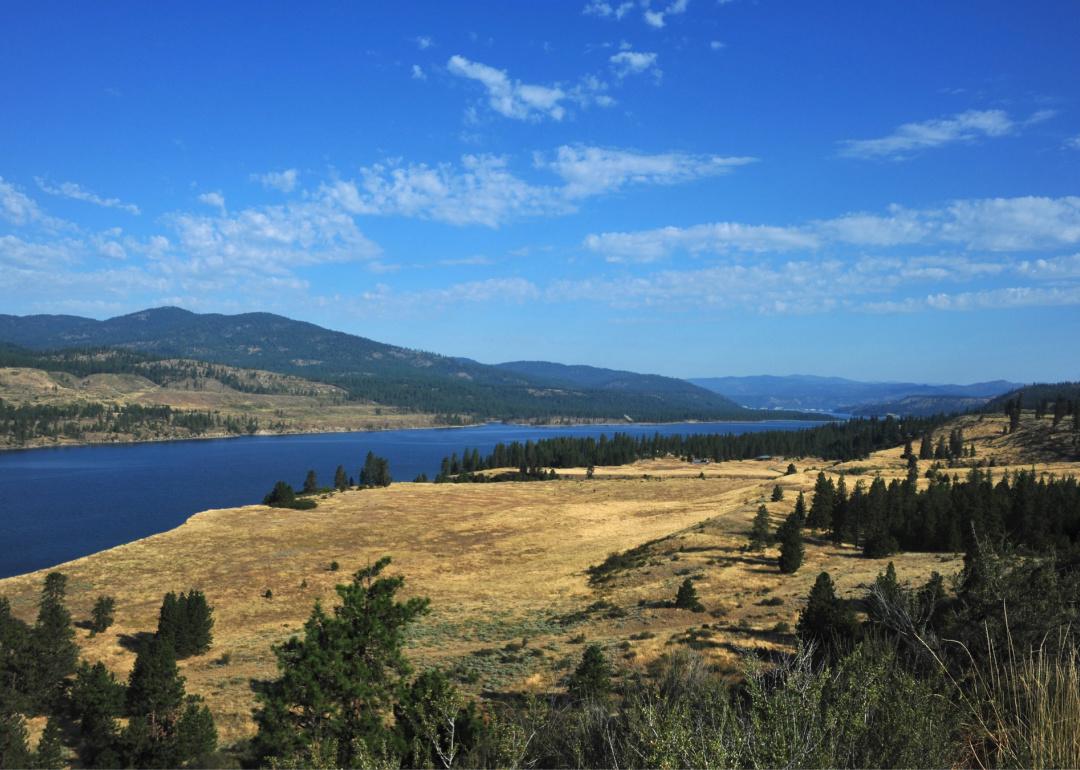
kathmanduphotog // Shutterstock

20 / 20

#1. Ferry County

- Bridges in poor condition: 13.2% (7 of 53 bridges)
- Square meters of bridges in poor condition: 14.0% (1,308 of 9,336 square meters of bridges)