Most diverse counties in Washington

·Stacker

Canva
Canva

The United States has a longstanding reputation as being a melting pot (or salad bowl), with its diversity manifesting itself across many different demographics. However, some places across the country are notably more heterogeneous than others.

Stacker compiled a list of the most diverse counties in Washington using data from using data from the U.S. Census Bureau. Counties are ranked by the highest Simpson's diversity index score. Simpson's diversity index measures community diversity on a scale of 0 (least diverse) to 1 (most diverse), more on the calculation can be read here.

Think you know which counties in your home state might be the most diverse? Keep reading to see if your predictions are correct.

You may also like: Fastest-growing jobs in Washington

#39. Lincoln County

Publichall // Wikimedia Commons

1 / 39

#39. Lincoln County

- Index: 0.126
- Total population: 10,574
- White: 93.4% (9,881)
- Black or African American: 0.8% (83)
- American Indian and Alaska Native: 1.5% (162)
- Asian: 0.7% (69)
- Native Hawaiian and other Pacific Islander: 0.3% (27)
- 2 or more races: 2.6% (271)
- Some other Race: 0.8% (81)
#38. Klickitat County

MagicalT // Wikimedia Commons

2 / 39

#38. Klickitat County

- Index: 0.136
- Total population: 21,721
- White: 92.9% (20,173)
- Black or African American: 0.7% (160)
- American Indian and Alaska Native: 2.5% (548)
- Asian: 0.7% (155)
- Native Hawaiian and other Pacific Islander: 0.0% (2)
- 2 or more races: 2.2% (473)
- Some other Race: 1.0% (210)
#37. Skamania County

U.S. Geological Survey // Wikimedia Commons

3 / 39

#37. Skamania County

- Index: 0.137
- Total population: 11,753
- White: 92.8% (10,911)
- Black or African American: 0.5% (58)
- American Indian and Alaska Native: 1.8% (213)
- Asian: 1.1% (131)
- Native Hawaiian and other Pacific Islander: 0.1% (14)
- 2 or more races: 2.3% (275)
- Some other Race: 1.3% (151)
#36. Asotin County

Williamborg // Wikimedia Commons

4 / 39

#36. Asotin County

- Index: 0.143
- Total population: 22,421
- White: 92.5% (20,731)
- Black or African American: 0.5% (116)
- American Indian and Alaska Native: 1.1% (256)
- Asian: 0.9% (192)
- Native Hawaiian and other Pacific Islander: 0.2% (51)
- 2 or more races: 3.9% (865)
- Some other Race: 0.9% (210)
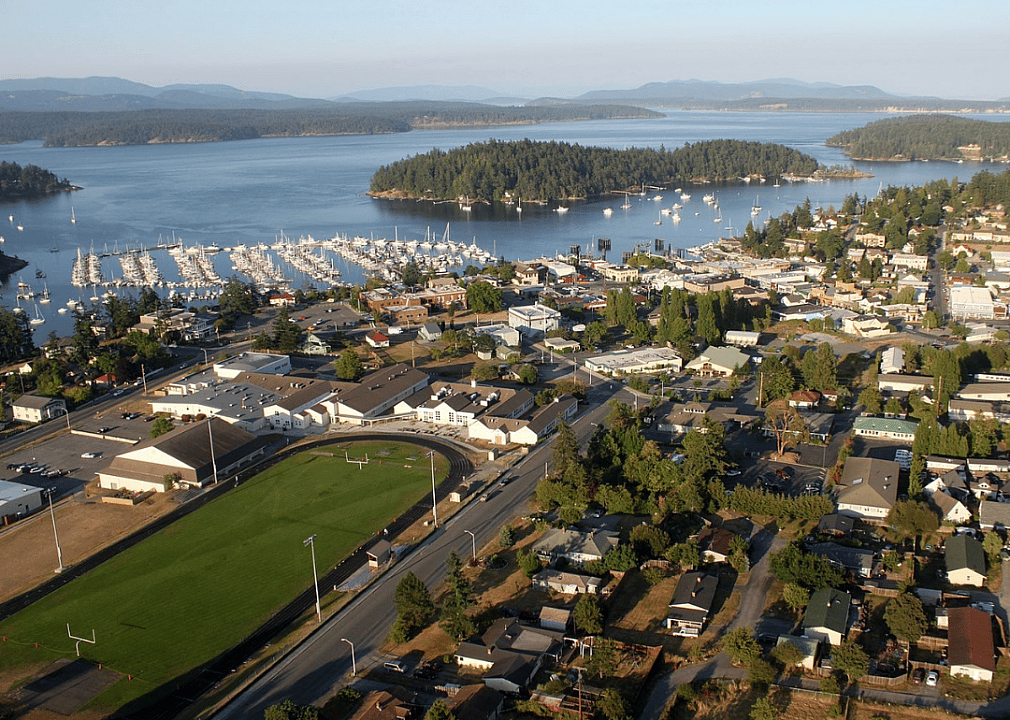
#35. San Juan County

Jelson25 // Wikimedia Commons

5 / 39

#35. San Juan County

- Index: 0.147
- Total population: 16,788
- White: 92.3% (15,497)
- Black or African American: 0.9% (149)
- American Indian and Alaska Native: 1.0% (163)
- Asian: 1.3% (219)
- Native Hawaiian and other Pacific Islander: 0.2% (39)
- 2 or more races: 2.5% (418)
- Some other Race: 1.8% (303)

You may also like: Best public middle schools in Washington

#34. Garfield County

Calvin Beale // Wikimedia Commons

6 / 39

#34. Garfield County

- Index: 0.162
- Total population: 2,230
- White: 91.3% (2,037)
- Black or African American: 0.0% (0)
- American Indian and Alaska Native: 0.0% (0)
- Asian: 3.2% (71)
- Native Hawaiian and other Pacific Islander: 0.0% (0)
- 2 or more races: 5.5% (122)
- Some other Race: 0.0% (0)
#33. Jefferson County

Adbar // Wikimedia Commons

7 / 39

#33. Jefferson County

- Index: 0.172
- Total population: 31,285
- White: 90.9% (28,425)
- Black or African American: 0.6% (178)
- American Indian and Alaska Native: 2.0% (625)
- Asian: 1.6% (516)
- Native Hawaiian and other Pacific Islander: 0.2% (57)
- 2 or more races: 3.8% (1,195)
- Some other Race: 0.9% (289)
#32. Wahkiakum County

Walter Siegmund // Wikimedia Commons

8 / 39

#32. Wahkiakum County

- Index: 0.173
- Total population: 4,268
- White: 90.8% (3,877)
- Black or African American: 1.3% (54)
- American Indian and Alaska Native: 0.7% (31)
- Asian: 1.9% (79)
- Native Hawaiian and other Pacific Islander: 0.0% (1)
- 2 or more races: 1.7% (72)
- Some other Race: 3.6% (154)
#31. Lewis County

Steven Pavlov // Wikimedia Commons

9 / 39

#31. Lewis County

- Index: 0.188
- Total population: 78,145
- White: 89.9% (70,251)
- Black or African American: 0.5% (414)
- American Indian and Alaska Native: 0.7% (508)
- Asian: 1.3% (1,024)
- Native Hawaiian and other Pacific Islander: 0.2% (174)
- 2 or more races: 5.3% (4,160)
- Some other Race: 2.1% (1,614)
#30. Pend Oreille County

Ruthven78 // Wikimedia Commons

10 / 39

#30. Pend Oreille County

- Index: 0.190
- Total population: 13,377
- White: 89.9% (12,021)
- Black or African American: 0.4% (49)
- American Indian and Alaska Native: 3.9% (523)
- Asian: 1.0% (130)
- Native Hawaiian and other Pacific Islander: 0.0% (3)
- 2 or more races: 2.6% (352)
- Some other Race: 2.2% (299)

You may also like: Countries to which Washington exports the most goods

#29. Columbia County

John Stanton // Wikimedia Commons

11 / 39

#29. Columbia County

- Index: 0.198
- Total population: 3,992
- White: 89.4% (3,568)
- Black or African American: 0.9% (36)
- American Indian and Alaska Native: 0.2% (7)
- Asian: 1.8% (72)
- Native Hawaiian and other Pacific Islander: 1.1% (42)
- 2 or more races: 5.3% (212)
- Some other Race: 1.4% (55)
#28. Stevens County

BrandonHansen18 // Wikimedia Commons

12 / 39

#28. Stevens County

- Index: 0.202
- Total population: 44,655
- White: 89.1% (39,788)
- Black or African American: 0.4% (192)
- American Indian and Alaska Native: 5.0% (2,225)
- Asian: 0.6% (290)
- Native Hawaiian and other Pacific Islander: 0.1% (55)
- 2 or more races: 3.8% (1,715)
- Some other Race: 0.9% (390)
#27. Cowlitz County

Sam Beebe // Wikimedia Commons

13 / 39

#27. Cowlitz County

- Index: 0.205
- Total population: 106,778
- White: 89.0% (94,987)
- Black or African American: 0.8% (847)
- American Indian and Alaska Native: 1.5% (1,625)
- Asian: 1.3% (1,365)
- Native Hawaiian and other Pacific Islander: 0.2% (217)
- 2 or more races: 5.6% (6,000)
- Some other Race: 1.6% (1,737)
#26. Kittitas County

MrX // Wikimedia Commons

14 / 39

#26. Kittitas County

- Index: 0.214
- Total population: 45,897
- White: 88.5% (40,611)
- Black or African American: 1.0% (443)
- American Indian and Alaska Native: 0.6% (285)
- Asian: 1.6% (729)
- Native Hawaiian and other Pacific Islander: 0.9% (401)
- 2 or more races: 3.7% (1,702)
- Some other Race: 3.8% (1,726)
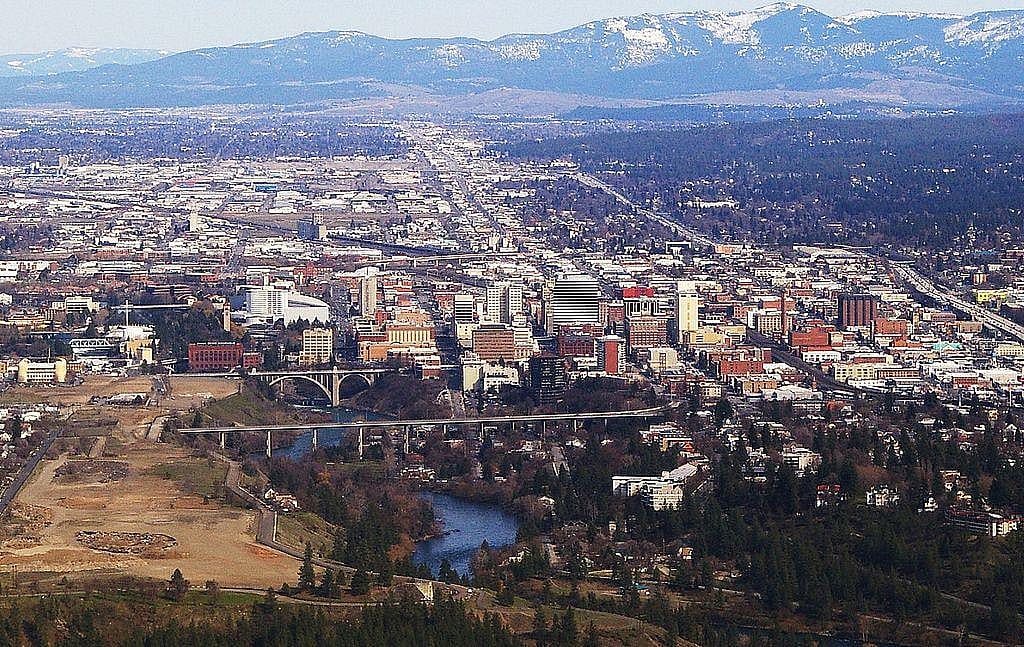
#25. Spokane County

Ron Reiring // Wikicommons

15 / 39

#25. Spokane County

- Index: 0.226
- Total population: 505,505
- White: 87.8% (443,791)
- Black or African American: 1.7% (8,444)
- American Indian and Alaska Native: 1.3% (6,817)
- Asian: 2.3% (11,553)
- Native Hawaiian and other Pacific Islander: 0.6% (2,799)
- 2 or more races: 4.8% (24,212)
- Some other Race: 1.6% (7,889)

You may also like: The truth about minimum coverage requirements in Washington

#24. Clallam County

Neonstar // Wikimedia Commons

16 / 39

#24. Clallam County

- Index: 0.226
- Total population: 75,392
- White: 87.7% (66,144)
- Black or African American: 1.1% (825)
- American Indian and Alaska Native: 4.9% (3,701)
- Asian: 1.7% (1,284)
- Native Hawaiian and other Pacific Islander: 0.0% (21)
- 2 or more races: 3.9% (2,904)
- Some other Race: 0.7% (513)
#23. Grays Harbor County

Joe Mabel // Wikimedia Commons

17 / 39

#23. Grays Harbor County

- Index: 0.227
- Total population: 72,779
- White: 87.7% (63,802)
- Black or African American: 1.2% (859)
- American Indian and Alaska Native: 4.2% (3,075)
- Asian: 1.5% (1,096)
- Native Hawaiian and other Pacific Islander: 0.3% (200)
- 2 or more races: 4.3% (3,164)
- Some other Race: 0.8% (583)
#22. Pacific County

Sam Beebe // Wikimedia Commons

18 / 39

#22. Pacific County

- Index: 0.236
- Total population: 21,688
- White: 87.2% (18,907)
- Black or African American: 0.4% (76)
- American Indian and Alaska Native: 2.5% (549)
- Asian: 1.7% (365)
- Native Hawaiian and other Pacific Islander: 0.4% (86)
- 2 or more races: 3.8% (819)
- Some other Race: 4.1% (886)
#21. Clark County

Steve Morgan // Wikimedia Commons

19 / 39

#21. Clark County

- Index: 0.279
- Total population: 473,252
- White: 84.6% (400,298)
- Black or African American: 1.8% (8,409)
- American Indian and Alaska Native: 0.6% (2,764)
- Asian: 4.6% (21,752)
- Native Hawaiian and other Pacific Islander: 0.8% (3,751)
- 2 or more races: 5.1% (24,064)
- Some other Race: 2.6% (12,214)
#20. Island County

Joe Mabel // Wikimedia Commons

20 / 39

#20. Island County

- Index: 0.279
- Total population: 82,866
- White: 84.6% (70,072)
- Black or African American: 3.1% (2,603)
- American Indian and Alaska Native: 1.0% (840)
- Asian: 4.9% (4,046)
- Native Hawaiian and other Pacific Islander: 0.4% (316)
- 2 or more races: 4.7% (3,875)
- Some other Race: 1.3% (1,114)

You may also like: Coldest Decembers in Washington since 1895

#19. Walla Walla County

Squarestate7 // Wikicommons

21 / 39

#19. Walla Walla County

- Index: 0.291
- Total population: 60,365
- White: 83.7% (50,534)
- Black or African American: 1.8% (1,074)
- American Indian and Alaska Native: 0.7% (393)
- Asian: 1.7% (999)
- Native Hawaiian and other Pacific Islander: 0.2% (99)
- 2 or more races: 4.6% (2,767)
- Some other Race: 7.5% (4,499)
#18. Mason County

Ian Poellet // Wikimedia Commons

22 / 39

#18. Mason County

- Index: 0.296
- Total population: 63,804
- White: 83.5% (53,269)
- Black or African American: 1.3% (800)
- American Indian and Alaska Native: 2.5% (1,591)
- Asian: 1.2% (752)
- Native Hawaiian and other Pacific Islander: 0.4% (277)
- 2 or more races: 5.8% (3,717)
- Some other Race: 5.3% (3,398)
#17. Whatcom County

Nick Kelly / Faithlife Corporation

23 / 39

#17. Whatcom County

- Index: 0.299
- Total population: 220,821
- White: 83.3% (184,006)
- Black or African American: 1.0% (2,204)
- American Indian and Alaska Native: 2.9% (6,437)
- Asian: 4.1% (9,120)
- Native Hawaiian and other Pacific Islander: 0.3% (668)
- 2 or more races: 4.7% (10,328)
- Some other Race: 3.6% (8,058)
#16. Whitman County

Ilyaunfois // Wikimedia Commons

24 / 39

#16. Whitman County

- Index: 0.311
- Total population: 49,231
- White: 82.4% (40,573)
- Black or African American: 2.2% (1,084)
- American Indian and Alaska Native: 0.3% (170)
- Asian: 8.5% (4,169)
- Native Hawaiian and other Pacific Islander: 0.2% (81)
- 2 or more races: 4.8% (2,355)
- Some other Race: 1.6% (799)
#15. Benton County

formulanone // Wikimedia Commons

25 / 39

#15. Benton County

- Index: 0.315
- Total population: 197,518
- White: 82.1% (162,240)
- Black or African American: 1.6% (3,198)
- American Indian and Alaska Native: 0.8% (1,526)
- Asian: 2.6% (5,069)
- Native Hawaiian and other Pacific Islander: 0.1% (141)
- 2 or more races: 3.9% (7,705)
- Some other Race: 8.9% (17,639)

You may also like: Hottest Decembers in Washington since 1895

#14. Skagit County

Joe Mabel // Wikicommons

26 / 39

#14. Skagit County

- Index: 0.315
- Total population: 125,612
- White: 82.1% (103,131)
- Black or African American: 0.9% (1,110)
- American Indian and Alaska Native: 1.9% (2,356)
- Asian: 1.9% (2,388)
- Native Hawaiian and other Pacific Islander: 0.2% (311)
- 2 or more races: 3.9% (4,885)
- Some other Race: 9.1% (11,431)
#13. Thurston County

Joe Mabel // Wikicommons

27 / 39

#13. Thurston County

- Index: 0.328
- Total population: 279,711
- White: 81.5% (227,952)
- Black or African American: 3.2% (8,826)
- American Indian and Alaska Native: 1.4% (3,810)
- Asian: 5.7% (15,832)
- Native Hawaiian and other Pacific Islander: 0.8% (2,265)
- 2 or more races: 6.1% (16,970)
- Some other Race: 1.5% (4,056)
#12. Chelan County

Jennifer Gottwald // Wikicommons

28 / 39

#12. Chelan County

- Index: 0.334
- Total population: 76,229
- White: 80.4% (61,268)
- Black or African American: 0.6% (492)
- American Indian and Alaska Native: 0.9% (651)
- Asian: 0.8% (615)
- Native Hawaiian and other Pacific Islander: 0.0% (31)
- 2 or more races: 3.8% (2,890)
- Some other Race: 13.5% (10,282)
#11. Kitsap County

Dcoetzee // Wikimedia Commons

29 / 39

#11. Kitsap County

- Index: 0.337
- Total population: 265,882
- White: 80.9% (215,015)
- Black or African American: 2.7% (7,129)
- American Indian and Alaska Native: 1.0% (2,596)
- Asian: 4.8% (12,876)
- Native Hawaiian and other Pacific Islander: 0.8% (2,174)
- 2 or more races: 7.6% (20,211)
- Some other Race: 2.2% (5,881)
#10. Yakima County

Michael S. Shannon // Wikimedia Commons

30 / 39

#10. Yakima County

- Index: 0.383
- Total population: 249,697
- White: 77.3% (192,911)
- Black or African American: 1.2% (2,918)

- American Indian and Alaska Native: 4.0% (10,004)
- Asian: 1.0% (2,447)
- Native Hawaiian and other Pacific Islander: 0.1% (288)
- 2 or more races: 3.3% (8,260)
- Some other Race: 13.2% (32,869)

You may also like: More electric vehicles means less gas tax revenue: How this impacts Washington's budget

#9. Ferry County

Kevmi // Wikimedia Commons

31 / 39

#9. Ferry County

- Index: 0.392
- Total population: 7,578
- White: 76.4% (5,789)
- Black or African American: 0.1% (11)
- American Indian and Alaska Native: 13.1% (994)
- Asian: 0.7% (53)
- Native Hawaiian and other Pacific Islander: 0.3% (20)
- 2 or more races: 8.6% (654)
- Some other Race: 0.8% (57)
#8. Snohomish County

SounderBruce // Wikimedia Commons

32 / 39

#8. Snohomish County

- Index: 0.415
- Total population: 798,808
- White: 75.4% (601,915)
- Black or African American: 3.1% (24,369)
- American Indian and Alaska Native: 0.9% (7,353)
- Asian: 10.8% (86,121)
- Native Hawaiian and other Pacific Islander: 0.5% (4,197)
- 2 or more races: 6.3% (50,089)
- Some other Race: 3.1% (24,764)
#7. Okanogan County

Bouldernavigator // Wikimedia Commons

33 / 39

#7. Okanogan County

- Index: 0.451
- Total population: 41,842
- White: 72.5% (30,320)
- Black or African American: 0.4% (186)
- American Indian and Alaska Native: 9.6% (4,019)
- Asian: 0.9% (358)
- Native Hawaiian and other Pacific Islander: 0.3% (106)
- 2 or more races: 5.5% (2,300)
- Some other Race: 10.9% (4,553)
#6. Pierce County

SounderBruce // Wikimedia Commons

34 / 39

#6. Pierce County

- Index: 0.451
- Total population: 877,013
- White: 72.9% (639,612)
- Black or African American: 6.8% (59,213)
- American Indian and Alaska Native: 1.3% (11,170)
- Asian: 6.3% (55,571)
- Native Hawaiian and other Pacific Islander: 1.5% (12,848)
- 2 or more races: 8.3% (72,509)
- Some other Race: 3.0% (26,090)
#5. Douglas County

Thayne Tuason // Wikimedia Commons

35 / 39

#5. Douglas County

- Index: 0.455
- Total population: 42,023
- White: 69.3% (29,137)
- Black or African American: 0.5% (203)
- American Indian and Alaska Native: 0.7% (300)
- Asian: 0.7% (305)
- Native Hawaiian and other Pacific Islander: 0.3% (112)
- 2 or more races: 3.4% (1,411)
- Some other Race: 25.1% (10,555)

You may also like: Biggest exports from Washington

#4. Franklin County

Williamborg // Wikimedia Commons

36 / 39

#4. Franklin County

- Index: 0.465
- Total population: 92,009
- White: 70.5% (64,838)
- Black or African American: 2.2% (2,068)
- American Indian and Alaska Native: 1.3% (1,163)
- Asian: 2.2% (2,016)
- Native Hawaiian and other Pacific Islander: 0.2% (195)
- 2 or more races: 4.8% (4,420)
- Some other Race: 18.8% (17,309)
#3. Grant County

Irra // Shutterstock

37 / 39

#3. Grant County

- Index: 0.467
- Total population: 95,502
- White: 68.9% (65,761)
- Black or African American: 0.8% (810)
- American Indian and Alaska Native: 1.2% (1,146)
- Asian: 1.0% (946)
- Native Hawaiian and other Pacific Islander: 0.0% (36)
- 2 or more races: 4.2% (4,034)
- Some other Race: 23.8% (22,769)
#2. Adams County

Joe Mabel // Wikimedia Commons

38 / 39

#2. Adams County

- Index: 0.502
- Total population: 19,594
- White: 65.1% (12,761)
- Black or African American: 1.0% (203)
- American Indian and Alaska Native: 4.1% (796)
- Asian: 0.8% (154)
- Native Hawaiian and other Pacific Islander: 0.2% (41)
- 2 or more races: 2.1% (405)
- Some other Race: 26.7% (5,234)
#1. King County

kan_khampanya // Shutterstock

39 / 39

#1. King County

- Index: 0.550
- Total population: 2.2 million
- White: 64.0% (1,404,324)
- Black or African American: 6.5% (141,790)
- American Indian and Alaska Native: 0.6% (13,057)
- Asian: 17.6% (386,404)
- Native Hawaiian and other Pacific Islander: 0.8% (16,944)
- 2 or more races: 6.4% (140,606)
- Some other Race: 4.2% (92,377)