Counties with the worst commutes in Tennessee
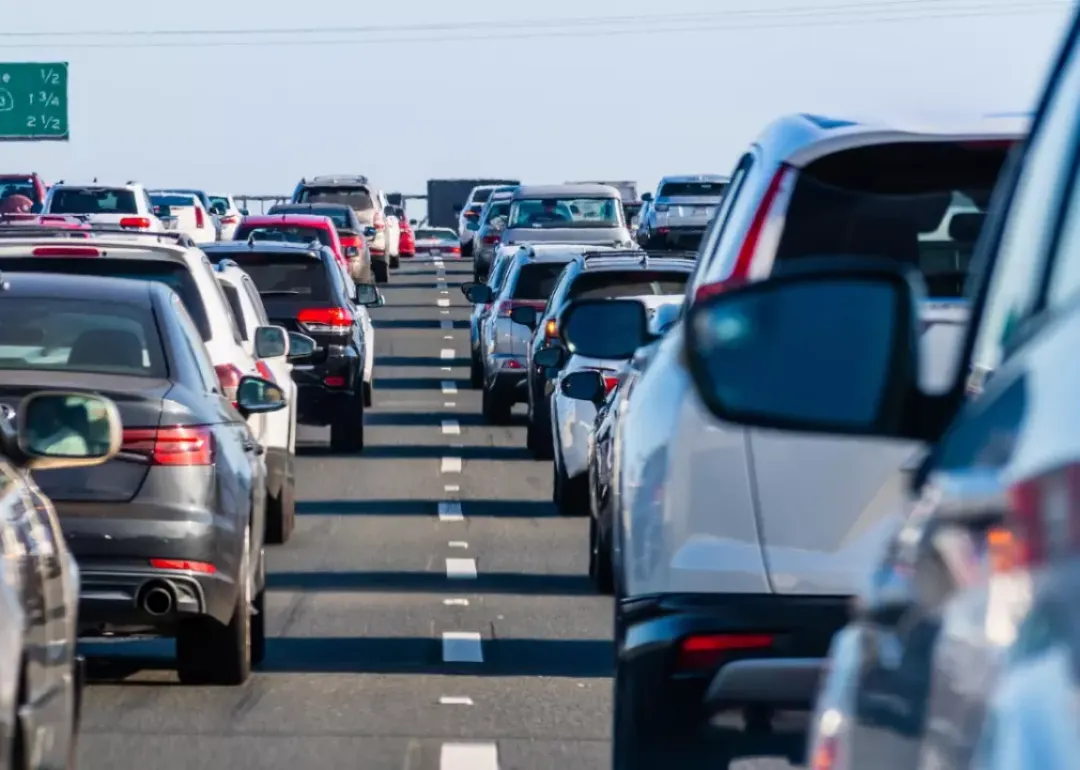
Commuting easily ranks as one of the least enjoyable parts of a person's day. Commuters encounter more physical health problems, and low-income commuters are less likely to gain financial stability—among a host of other negative impacts. And yet, America's commutes keep getting longer as people move farther away from the office, according to Census Bureau data.
Stacker compiled a list of counties with the worst commutes in Tennessee, using 2021 data from the Census Bureau. Counties are ranked by longest average commute time in 2021 among workers over the age of 16, excluding those who work from home. Think you have a long trip to work? Read on to compare it against the worst commutes statewide.
#50. Pickett County (tie)
- Average commute to work: 26.8 minutes
- Share with commutes over an hour: 11.1%
- Share that worked outside their county of residence: 27.2%
- Means of transportation to work:
--- Drove alone: 79.6%
--- Carpooled: 6.6%
--- Public transportation: 0%
--- Walked: 2.2%
--- Bicycle: 0%
--- Taxicab, motorcycle, or other means: 3.5%
--- Worked from home: 8.1%
#49. Scott County
- Average commute to work: 27 minutes
- Share with commutes over an hour: 16%
- Share that worked outside their county of residence: 19.7%
- Means of transportation to work:
--- Drove alone: 85.4%
--- Carpooled: 11.7%
--- Public transportation: 0%
--- Walked: 0.4%
--- Bicycle: 0%
--- Taxicab, motorcycle, or other means: 0.6%
--- Worked from home: 1.8%
#47. Hawkins County (tie)
- Average commute to work: 27.4 minutes
- Share with commutes over an hour: 8.1%
- Share that worked outside their county of residence: 49.5%
- Means of transportation to work:
--- Drove alone: 86.7%
--- Carpooled: 5.1%
--- Public transportation: 0.2%
--- Walked: 0.9%
--- Bicycle: 0.1%
--- Taxicab, motorcycle, or other means: 1.4%
--- Worked from home: 5.6%
#47. Johnson County (tie)
- Average commute to work: 27.4 minutes
- Share with commutes over an hour: 10.3%
- Share that worked outside their county of residence: 11.2%
- Means of transportation to work:
--- Drove alone: 81.4%
--- Carpooled: 10.5%
--- Public transportation: 0%
--- Walked: 1.1%
--- Bicycle: 0%
--- Taxicab, motorcycle, or other means: 0.3%
--- Worked from home: 6.7%
#45. Moore County (tie)
- Average commute to work: 27.8 minutes
- Share with commutes over an hour: 9.4%
- Share that worked outside their county of residence: 62.4%
- Means of transportation to work:
--- Drove alone: 86.8%
--- Carpooled: 7.1%
--- Public transportation: 0%
--- Walked: 0.1%
--- Bicycle: 0.6%
--- Taxicab, motorcycle, or other means: 0.5%
--- Worked from home: 4.9%
#45. Williamson County (tie)
- Average commute to work: 27.8 minutes
- Share with commutes over an hour: 5.9%
- Share that worked outside their county of residence: 32.6%
- Means of transportation to work:
--- Drove alone: 73.3%
--- Carpooled: 5.6%
--- Public transportation: 0.2%
--- Walked: 0.6%
--- Bicycle: 0%
--- Taxicab, motorcycle, or other means: 1%
--- Worked from home: 19.3%
#43. DeKalb County (tie)
- Average commute to work: 27.9 minutes
- Share with commutes over an hour: 14.6%
- Share that worked outside their county of residence: 42.5%
- Means of transportation to work:
--- Drove alone: 85.6%
--- Carpooled: 10.1%
--- Public transportation: 0%
--- Walked: 1.4%
--- Bicycle: 0%
--- Taxicab, motorcycle, or other means: 0.2%
--- Worked from home: 2.7%
#43. Perry County (tie)
- Average commute to work: 27.9 minutes
- Share with commutes over an hour: 10.8%
- Share that worked outside their county of residence: 29.5%
- Means of transportation to work:
--- Drove alone: 77.6%
--- Carpooled: 6.1%
--- Public transportation: 2.1%
--- Walked: 0.6%
--- Bicycle: 0.3%
--- Taxicab, motorcycle, or other means: 3.1%
--- Worked from home: 10.1%
#42. Carroll County
- Average commute to work: 28 minutes
- Share with commutes over an hour: 8.7%
- Share that worked outside their county of residence: 50.6%
- Means of transportation to work:
--- Drove alone: 80.2%
--- Carpooled: 8.5%
--- Public transportation: 0%
--- Walked: 2.2%
--- Bicycle: 0%
--- Taxicab, motorcycle, or other means: 3.9%
--- Worked from home: 5.2%
#40. Chester County (tie)
- Average commute to work: 28.4 minutes
- Share with commutes over an hour: 6%
- Share that worked outside their county of residence: 58.1%
- Means of transportation to work:
--- Drove alone: 85%
--- Carpooled: 6.2%
--- Public transportation: 0%
--- Walked: 0.6%
--- Bicycle: 0.4%
--- Taxicab, motorcycle, or other means: 0.9%
--- Worked from home: 6.8%
#40. Rutherford County (tie)
- Average commute to work: 28.4 minutes
- Share with commutes over an hour: 10%
- Share that worked outside their county of residence: 31.5%
- Means of transportation to work:
--- Drove alone: 79.3%
--- Carpooled: 9.5%
--- Public transportation: 0.3%
--- Walked: 0.8%
--- Bicycle: 0.2%
--- Taxicab, motorcycle, or other means: 0.7%
--- Worked from home: 9.2%
#39. Monroe County
- Average commute to work: 28.6 minutes
- Share with commutes over an hour: 8.8%
- Share that worked outside their county of residence: 39%
- Means of transportation to work:
--- Drove alone: 83.4%
--- Carpooled: 10.1%
--- Public transportation: 0.4%
--- Walked: 1.1%
--- Bicycle: 0.1%
--- Taxicab, motorcycle, or other means: 0.6%
--- Worked from home: 4.3%
#38. Roane County
- Average commute to work: 28.7 minutes
- Share with commutes over an hour: 7.3%
- Share that worked outside their county of residence: 50%
- Means of transportation to work:
--- Drove alone: 83.7%
--- Carpooled: 8.5%
--- Public transportation: 0%
--- Walked: 0.9%
--- Bicycle: 0%
--- Taxicab, motorcycle, or other means: 0.5%
--- Worked from home: 6.3%
#37. Giles County
- Average commute to work: 28.9 minutes
- Share with commutes over an hour: 16.3%
- Share that worked outside their county of residence: 30.3%
- Means of transportation to work:
--- Drove alone: 83.4%
--- Carpooled: 7.9%
--- Public transportation: 0%
--- Walked: 1.1%
--- Bicycle: 0.2%
--- Taxicab, motorcycle, or other means: 2.5%
--- Worked from home: 4.8%
#36. Maury County
- Average commute to work: 29.3 minutes
- Share with commutes over an hour: 10.9%
- Share that worked outside their county of residence: 39.3%
- Means of transportation to work:
--- Drove alone: 81.9%
--- Carpooled: 7.4%
--- Public transportation: 0%
--- Walked: 0.6%
--- Bicycle: 0%
--- Taxicab, motorcycle, or other means: 0.3%
--- Worked from home: 9.7%
#34. Lincoln County (tie)
- Average commute to work: 29.4 minutes
- Share with commutes over an hour: 12.9%
- Share that worked outside their county of residence: 20.4%
- Means of transportation to work:
--- Drove alone: 85.5%
--- Carpooled: 6.9%
--- Public transportation: 0.2%
--- Walked: 0.7%
--- Bicycle: 0%
--- Taxicab, motorcycle, or other means: 0.4%
--- Worked from home: 6.4%
#34. Morgan County (tie)
- Average commute to work: 29.4 minutes
- Share with commutes over an hour: 10.8%
- Share that worked outside their county of residence: 52.1%
- Means of transportation to work:
--- Drove alone: 83.1%
--- Carpooled: 11.1%
--- Public transportation: 0.2%
--- Walked: 0.5%
--- Bicycle: 0%
--- Taxicab, motorcycle, or other means: 0%
--- Worked from home: 5.1%
#32. Polk County (tie)
- Average commute to work: 29.5 minutes
- Share with commutes over an hour: 10.3%
- Share that worked outside their county of residence: 46.9%
- Means of transportation to work:
--- Drove alone: 81%
--- Carpooled: 11.3%
--- Public transportation: 0.4%
--- Walked: 1.2%
--- Bicycle: 0%
--- Taxicab, motorcycle, or other means: 0.6%
--- Worked from home: 5.5%
#32. Sumner County (tie)
- Average commute to work: 29.5 minutes
- Share with commutes over an hour: 11.2%
- Share that worked outside their county of residence: 40.8%
- Means of transportation to work:
--- Drove alone: 79.4%
--- Carpooled: 8.6%
--- Public transportation: 0.2%
--- Walked: 0.6%
--- Bicycle: 0.1%
--- Taxicab, motorcycle, or other means: 1.2%
--- Worked from home: 9.8%
#31. Cocke County
- Average commute to work: 29.6 minutes
- Share with commutes over an hour: 10.5%
- Share that worked outside their county of residence: 48.7%
- Means of transportation to work:
--- Drove alone: 82.4%
--- Carpooled: 10.6%
--- Public transportation: 0%
--- Walked: 1.4%
--- Bicycle: 0%
--- Taxicab, motorcycle, or other means: 1.7%
--- Worked from home: 4%
#30. Grundy County
- Average commute to work: 29.9 minutes
- Share with commutes over an hour: 13%
- Share that worked outside their county of residence: 50%
- Means of transportation to work:
--- Drove alone: 80.2%
--- Carpooled: 11%
--- Public transportation: 0.1%
--- Walked: 1.9%
--- Bicycle: 0%
--- Taxicab, motorcycle, or other means: 1.2%
--- Worked from home: 5.6%
#29. Jackson County
- Average commute to work: 30.1 minutes
- Share with commutes over an hour: 13.9%
- Share that worked outside their county of residence: 59.1%
- Means of transportation to work:
--- Drove alone: 81.9%
--- Carpooled: 12.5%
--- Public transportation: 0.1%
--- Walked: 1.3%
--- Bicycle: 0%
--- Taxicab, motorcycle, or other means: 0.7%
--- Worked from home: 3.6%
#26. Bledsoe County (tie)
- Average commute to work: 30.4 minutes
- Share with commutes over an hour: 14.4%
- Share that worked outside their county of residence: 58%
- Means of transportation to work:
--- Drove alone: 78.9%
--- Carpooled: 13%
--- Public transportation: 0.5%
--- Walked: 2.2%
--- Bicycle: 0%
--- Taxicab, motorcycle, or other means: 0.8%
--- Worked from home: 4.5%
#26. Marshall County (tie)
- Average commute to work: 30.4 minutes
- Share with commutes over an hour: 15.2%
- Share that worked outside their county of residence: 48.4%
- Means of transportation to work:
--- Drove alone: 85.3%
--- Carpooled: 6.2%
--- Public transportation: 0.1%
--- Walked: 0.8%
--- Bicycle: 0%
--- Taxicab, motorcycle, or other means: 0.4%
--- Worked from home: 7.2%
#26. Meigs County (tie)
- Average commute to work: 30.4 minutes
- Share with commutes over an hour: 10.3%
- Share that worked outside their county of residence: 69.6%
- Means of transportation to work:
--- Drove alone: 83.6%
--- Carpooled: 9.9%
--- Public transportation: 0.3%
--- Walked: 0.3%
--- Bicycle: 0.2%
--- Taxicab, motorcycle, or other means: 1.1%
--- Worked from home: 4.5%
#25. Wilson County
- Average commute to work: 30.6 minutes
- Share with commutes over an hour: 11%
- Share that worked outside their county of residence: 45.3%
- Means of transportation to work:
--- Drove alone: 79.8%
--- Carpooled: 8.6%
--- Public transportation: 0.6%
--- Walked: 0.6%
--- Bicycle: 0%
--- Taxicab, motorcycle, or other means: 0.9%
--- Worked from home: 9.5%
#23. Hancock County (tie)
- Average commute to work: 30.9 minutes
- Share with commutes over an hour: 16%
- Share that worked outside their county of residence: 45.9%
- Means of transportation to work:
--- Drove alone: 84.4%
--- Carpooled: 12.9%
--- Public transportation: 0%
--- Walked: 0%
--- Bicycle: 0%
--- Taxicab, motorcycle, or other means: 1.5%
--- Worked from home: 1.2%
#23. Lewis County (tie)
- Average commute to work: 30.9 minutes
- Share with commutes over an hour: 13.9%
- Share that worked outside their county of residence: 46.2%
- Means of transportation to work:
--- Drove alone: 83.2%
--- Carpooled: 6.9%
--- Public transportation: 0%
--- Walked: 0.7%
--- Bicycle: 0%
--- Taxicab, motorcycle, or other means: 3.3%
--- Worked from home: 5.8%
#21. Clay County (tie)
- Average commute to work: 31.1 minutes
- Share with commutes over an hour: 10.9%
- Share that worked outside their county of residence: 45.7%
- Means of transportation to work:
--- Drove alone: 82.2%
--- Carpooled: 10.7%
--- Public transportation: 0.6%
--- Walked: 0.6%
--- Bicycle: 0%
--- Taxicab, motorcycle, or other means: 2.8%
--- Worked from home: 3.1%
#21. Van Buren County (tie)
- Average commute to work: 31.1 minutes
- Share with commutes over an hour: 13%
- Share that worked outside their county of residence: 63.5%
- Means of transportation to work:
--- Drove alone: 81.7%
--- Carpooled: 6.1%
--- Public transportation: 0%
--- Walked: 3.4%
--- Bicycle: 0.4%
--- Taxicab, motorcycle, or other means: 1.9%
--- Worked from home: 6.6%
#20. Robertson County
- Average commute to work: 31.2 minutes
- Share with commutes over an hour: 10.8%
- Share that worked outside their county of residence: 52.7%
- Means of transportation to work:
--- Drove alone: 83.1%
--- Carpooled: 7%
--- Public transportation: 0.4%
--- Walked: 0.5%
--- Bicycle: 0%
--- Taxicab, motorcycle, or other means: 1.3%
--- Worked from home: 7.8%
#19. Marion County
- Average commute to work: 31.4 minutes
- Share with commutes over an hour: 10.8%
- Share that worked outside their county of residence: 43.2%
- Means of transportation to work:
--- Drove alone: 84.7%
--- Carpooled: 6.6%
--- Public transportation: 0%
--- Walked: 1.3%
--- Bicycle: 0%
--- Taxicab, motorcycle, or other means: 0.9%
--- Worked from home: 6.6%
#17. Sequatchie County (tie)
- Average commute to work: 31.6 minutes
- Share with commutes over an hour: 12.6%
- Share that worked outside their county of residence: 43%
- Means of transportation to work:
--- Drove alone: 80.6%
--- Carpooled: 9.9%
--- Public transportation: 0%
--- Walked: 1.8%
--- Bicycle: 0%
--- Taxicab, motorcycle, or other means: 1.5%
--- Worked from home: 6.3%
#17. Union County (tie)
- Average commute to work: 31.6 minutes
- Share with commutes over an hour: 11.2%
- Share that worked outside their county of residence: 59.1%
- Means of transportation to work:
--- Drove alone: 81.6%
--- Carpooled: 8.8%
--- Public transportation: 0%
--- Walked: 1.7%
--- Bicycle: 0%
--- Taxicab, motorcycle, or other means: 1.1%
--- Worked from home: 6.8%
#14. Campbell County (tie)
- Average commute to work: 31.7 minutes
- Share with commutes over an hour: 15.8%
- Share that worked outside their county of residence: 37.9%
- Means of transportation to work:
--- Drove alone: 82.2%
--- Carpooled: 11.2%
--- Public transportation: 0%
--- Walked: 0.6%
--- Bicycle: 0.1%
--- Taxicab, motorcycle, or other means: 0.2%
--- Worked from home: 5.7%
#14. Hardeman County (tie)
- Average commute to work: 31.7 minutes
- Share with commutes over an hour: 18.5%
- Share that worked outside their county of residence: 32.2%
- Means of transportation to work:
--- Drove alone: 84.1%
--- Carpooled: 6.8%
--- Public transportation: 2.5%
--- Walked: 0.8%
--- Bicycle: 0%
--- Taxicab, motorcycle, or other means: 1.1%
--- Worked from home: 4.6%
#14. Wayne County (tie)
- Average commute to work: 31.7 minutes
- Share with commutes over an hour: 16.1%
- Share that worked outside their county of residence: 26.8%
- Means of transportation to work:
--- Drove alone: 86%
--- Carpooled: 8.5%
--- Public transportation: 0%
--- Walked: 0.1%
--- Bicycle: 0%
--- Taxicab, motorcycle, or other means: 0.2%
--- Worked from home: 5.2%
#13. Grainger County
- Average commute to work: 32.6 minutes
- Share with commutes over an hour: 11.6%
- Share that worked outside their county of residence: 64.3%
- Means of transportation to work:
--- Drove alone: 78.4%
--- Carpooled: 12.4%
--- Public transportation: 0%
--- Walked: 0.3%
--- Bicycle: 0%
--- Taxicab, motorcycle, or other means: 0.3%
--- Worked from home: 8.6%
#12. Smith County
- Average commute to work: 33 minutes
- Share with commutes over an hour: 17.1%
- Share that worked outside their county of residence: 46.3%
- Means of transportation to work:
--- Drove alone: 85.1%
--- Carpooled: 7.7%
--- Public transportation: 0.2%
--- Walked: 0.2%
--- Bicycle: 0.1%
--- Taxicab, motorcycle, or other means: 1.9%
--- Worked from home: 4.8%
#11. Dickson County
- Average commute to work: 33.1 minutes
- Share with commutes over an hour: 18.3%
- Share that worked outside their county of residence: 42.7%
- Means of transportation to work:
--- Drove alone: 84.7%
--- Carpooled: 8.9%
--- Public transportation: 0.1%
--- Walked: 0.4%
--- Bicycle: 0.1%
--- Taxicab, motorcycle, or other means: 1.2%
--- Worked from home: 4.4%
#10. Fayette County
- Average commute to work: 33.4 minutes
- Share with commutes over an hour: 10.7%
- Share that worked outside their county of residence: 64.5%
- Means of transportation to work:
--- Drove alone: 81.6%
--- Carpooled: 7.9%
--- Public transportation: 0.1%
--- Walked: 0.6%
--- Bicycle: 0%
--- Taxicab, motorcycle, or other means: 2.6%
--- Worked from home: 7.2%
#9. Cheatham County
- Average commute to work: 33.8 minutes
- Share with commutes over an hour: 11.1%
- Share that worked outside their county of residence: 64.2%
- Means of transportation to work:
--- Drove alone: 78.4%
--- Carpooled: 11.6%
--- Public transportation: 0.2%
--- Walked: 0.3%
--- Bicycle: 0%
--- Taxicab, motorcycle, or other means: 1.2%
--- Worked from home: 8.3%
#8. Cannon County
- Average commute to work: 34 minutes
- Share with commutes over an hour: 12.3%
- Share that worked outside their county of residence: 69%
- Means of transportation to work:
--- Drove alone: 84.9%
--- Carpooled: 7.3%
--- Public transportation: 0%
--- Walked: 0.8%
--- Bicycle: 0%
--- Taxicab, motorcycle, or other means: 0.1%
--- Worked from home: 6.8%
#7. Tipton County
- Average commute to work: 34.2 minutes
- Share with commutes over an hour: 14.7%
- Share that worked outside their county of residence: 61.5%
- Means of transportation to work:
--- Drove alone: 85.9%
--- Carpooled: 7.3%
--- Public transportation: 0%
--- Walked: 0.7%
--- Bicycle: 0%
--- Taxicab, motorcycle, or other means: 1.2%
--- Worked from home: 5%
#6. Humphreys County
- Average commute to work: 34.6 minutes
- Share with commutes over an hour: 19.6%
- Share that worked outside their county of residence: 40.4%
- Means of transportation to work:
--- Drove alone: 84.6%
--- Carpooled: 10.7%
--- Public transportation: 0%
--- Walked: 0.5%
--- Bicycle: 0%
--- Taxicab, motorcycle, or other means: 0.4%
--- Worked from home: 3.8%
#5. Macon County
- Average commute to work: 35.7 minutes
- Share with commutes over an hour: 21.4%
- Share that worked outside their county of residence: 49.1%
- Means of transportation to work:
--- Drove alone: 81.6%
--- Carpooled: 13.4%
--- Public transportation: 0%
--- Walked: 0.3%
--- Bicycle: 0%
--- Taxicab, motorcycle, or other means: 1.8%
--- Worked from home: 3%
#4. Hickman County
- Average commute to work: 37 minutes
- Share with commutes over an hour: 19.2%
- Share that worked outside their county of residence: 60.3%
- Means of transportation to work:
--- Drove alone: 77.9%
--- Carpooled: 12%
--- Public transportation: 0%
--- Walked: 2%
--- Bicycle: 0%
--- Taxicab, motorcycle, or other means: 1.1%
--- Worked from home: 6.9%
#3. Stewart County
- Average commute to work: 37.5 minutes
- Share with commutes over an hour: 13.6%
- Share that worked outside their county of residence: 47.1%
- Means of transportation to work:
--- Drove alone: 79.5%
--- Carpooled: 14.9%
--- Public transportation: 0.5%
--- Walked: 1.1%
--- Bicycle: 0%
--- Taxicab, motorcycle, or other means: 1.7%
--- Worked from home: 2.3%
#2. Houston County
- Average commute to work: 39.2 minutes
- Share with commutes over an hour: 22.4%
- Share that worked outside their county of residence: 65.7%
- Means of transportation to work:
--- Drove alone: 75.9%
--- Carpooled: 15.8%
--- Public transportation: 0.5%
--- Walked: 1.4%
--- Bicycle: 0%
--- Taxicab, motorcycle, or other means: 2.5%
--- Worked from home: 3.9%
#1. Trousdale County
- Average commute to work: 43 minutes
- Share with commutes over an hour: 25.4%
- Share that worked outside their county of residence: 79.2%
- Means of transportation to work:
--- Drove alone: 75.9%
--- Carpooled: 18.9%
--- Public transportation: 0%
--- Walked: 0%
--- Bicycle: 0%
--- Taxicab, motorcycle, or other means: 0%
--- Worked from home: 5.2%


