Counties with the most emergency shelters in Texas
As climate change drives weather to greater extremes, and devastating hurricanes, wildfires, droughts, and blizzards preoccupy an increasing number of Americans, it is hard to avoid comparing the reality of everyday news coverage to the computer-generated images seen in disaster movies.
Over the last 50 years, natural disasters have become five times more common due to climate change, according to the World Meteorological Organization. They've also become more economically debilitating—the five most expensive climate disasters in American history have all taken place over the last two decades.
The increasing frequency and severity of natural disasters means that the need for emergency evacuation and shelter plans has never been greater. According to the Federal Emergency Management Association, understanding your climate risk, or proximity to probable natural disaster, is an important first step for making a plan. Tools like the Climate Mapping for Resilience and Adaptation allow you to assess your risk by location.
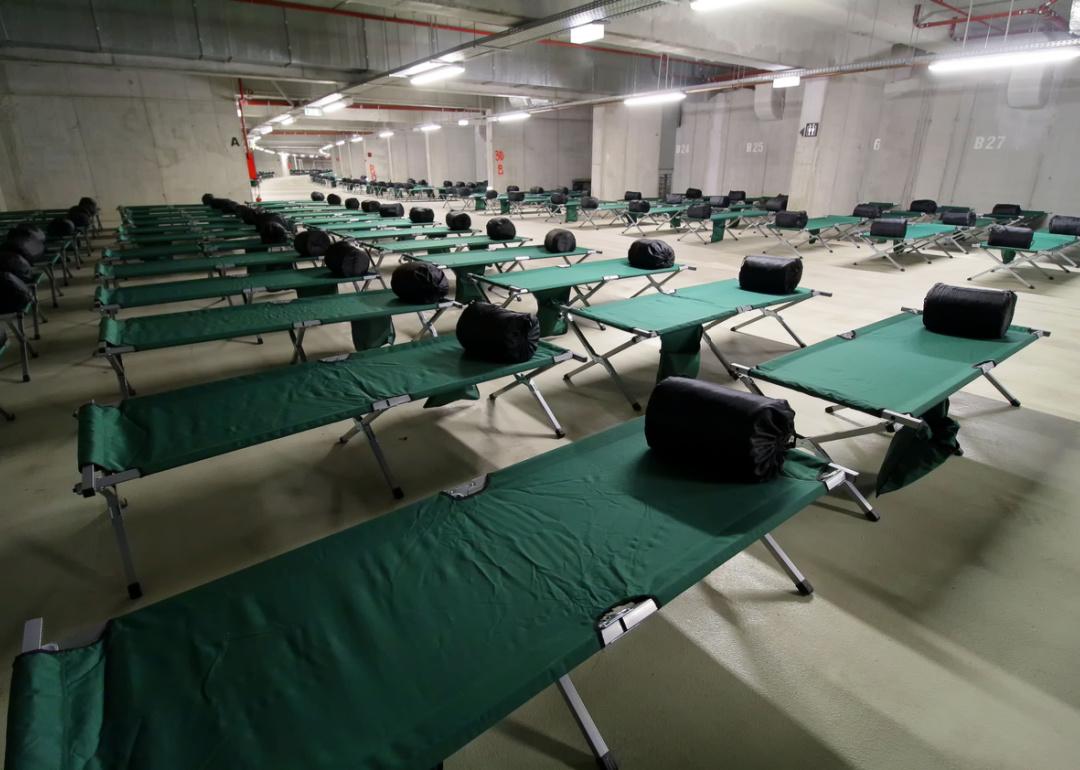
Knowing where nearby emergency shelters are located is another way to prepare for the worst. In the event of flooding, hurricane-level winds, or other disasters, emergency shelters offer a place to sleep, and also often provide food, water, and first aid services. Stacker examined the Department of Homeland Security's National Shelter System Facilities database to identify the counties with the most emergency shelters in Texas. Counties are ranked by emergency shelters per 100K people, with total capacity per 100K people serving as a tiebreaker.
Editor's Note: A previous version of this story incorrectly stated the total emergency shelter capacity in each county. Due to the variable availability of that data for each shelter, the data point has been removed from the updated version.
#50. Titus County
- Shelters listed with generators: 1
- Shelters listed in 100-year floodplain: 0
#49. Refugio County
- Shelters listed with generators: 0
- Shelters listed in 100-year floodplain: 0
#48. Jack County
- Shelters listed with generators: 0
- Shelters listed in 100-year floodplain: 0
#47. Childress County
- Shelters listed with generators: 0
- Shelters listed in 100-year floodplain: 0
#46. Ochiltree County
- Shelters listed with generators: 0
- Shelters listed in 100-year floodplain: 0
#45. Duval County
- Shelters listed with generators: 0
- Shelters listed in 100-year floodplain: 0
#44. Lamb County
- Shelters listed with generators: 0
- Shelters listed in 100-year floodplain: 0
#43. Matagorda County
- Shelters listed with generators: 0
- Shelters listed in 100-year floodplain: 0
#42. Montague County
- Shelters listed with generators: 0
- Shelters listed in 100-year floodplain: 0
#41. Collingsworth County
- Shelters listed with generators: 0
- Shelters listed in 100-year floodplain: 0
#40. Bailey County
- Shelters listed with generators: 0
- Shelters listed in 100-year floodplain: 1
#39. Callahan County
- Shelters listed with generators: 0
- Shelters listed in 100-year floodplain: 0
#38. Edwards County
- Shelters listed with generators: 0
- Shelters listed in 100-year floodplain: 0
#37. Hansford County
- Shelters listed with generators: 0
- Shelters listed in 100-year floodplain: 0
#36. Crosby County
- Shelters listed with generators: 0
- Shelters listed in 100-year floodplain: 0
#35. Navarro County
- Shelters listed with generators: 1
- Shelters listed in 100-year floodplain: 0
#34. Wheeler County
- Shelters listed with generators: 0
- Shelters listed in 100-year floodplain: 0
#33. Fisher County
- Shelters listed with generators: 0
- Shelters listed in 100-year floodplain: 0
#32. Archer County
- Shelters listed with generators: 0
- Shelters listed in 100-year floodplain: 0
#31. Lamar County
- Shelters listed with generators: 6
- Shelters listed in 100-year floodplain: 0
#30. La Salle County
- Shelters listed with generators: 0
- Shelters listed in 100-year floodplain: 0
#29. Fannin County
- Shelters listed with generators: 0
- Shelters listed in 100-year floodplain: 0
#28. Knox County
- Shelters listed with generators: 0
- Shelters listed in 100-year floodplain: 0
#27. Donley County
- Shelters listed with generators: 1
- Shelters listed in 100-year floodplain: 0
#26. Gonzales County
- Shelters listed with generators: 0
- Shelters listed in 100-year floodplain: 0
#25. Mason County
- Shelters listed with generators: 0
- Shelters listed in 100-year floodplain: 0
#24. Crockett County
- Shelters listed with generators: 0
- Shelters listed in 100-year floodplain: 0
#23. Lynn County
- Shelters listed with generators: 0
- Shelters listed in 100-year floodplain: 0
#22. Crane County
- Shelters listed with generators: 0
- Shelters listed in 100-year floodplain: 0
#21. Clay County
- Shelters listed with generators: 0
- Shelters listed in 100-year floodplain: 0
#20. Haskell County
- Shelters listed with generators: 0
- Shelters listed in 100-year floodplain: 0
#19. Delta County
- Shelters listed with generators: 0
- Shelters listed in 100-year floodplain: 0
#18. Baylor County
- Shelters listed with generators: 1
- Shelters listed in 100-year floodplain: 0
#17. Hemphill County
- Shelters listed with generators: 0
- Shelters listed in 100-year floodplain: 0
#16. Kimble County
- Shelters listed with generators: 0
- Shelters listed in 100-year floodplain: 0
#15. Sutton County
- Shelters listed with generators: 0
- Shelters listed in 100-year floodplain: 0
#14. Cottle County
- Shelters listed with generators: 0
- Shelters listed in 100-year floodplain: 0
#13. Throckmorton County
- Shelters listed with generators: 0
- Shelters listed in 100-year floodplain: 0
#12. Oldham County
- Shelters listed with generators: 0
- Shelters listed in 100-year floodplain: 0
#11. Foard County
- Shelters listed with generators: 0
- Shelters listed in 100-year floodplain: 0
#10. Armstrong County
- Shelters listed with generators: 0
- Shelters listed in 100-year floodplain: 0
#9. Shackelford County
- Shelters listed with generators: 2
- Shelters listed in 100-year floodplain: 0
#8. Motley County
- Shelters listed with generators: 0
- Shelters listed in 100-year floodplain: 0
#7. Menard County
- Shelters listed with generators: 0
- Shelters listed in 100-year floodplain: 0
#6. Upton County
- Shelters listed with generators: 0
- Shelters listed in 100-year floodplain: 0
#5. Roberts County
- Shelters listed with generators: 0
- Shelters listed in 100-year floodplain: 0
#4. Hall County
- Shelters listed with generators: 0
- Shelters listed in 100-year floodplain: 0
#3. Dickens County
- Shelters listed with generators: 0
- Shelters listed in 100-year floodplain: 0
#2. King County
- Shelters listed with generators: 0
- Shelters listed in 100-year floodplain: 0
#1. Kent County
- Shelters listed with generators: 0
- Shelters listed in 100-year floodplain: 0


