Counties with the most renters in Texas
Written by:
February 24, 2021
Updated on February 25, 2021
Arina P Habich // Shutterstock
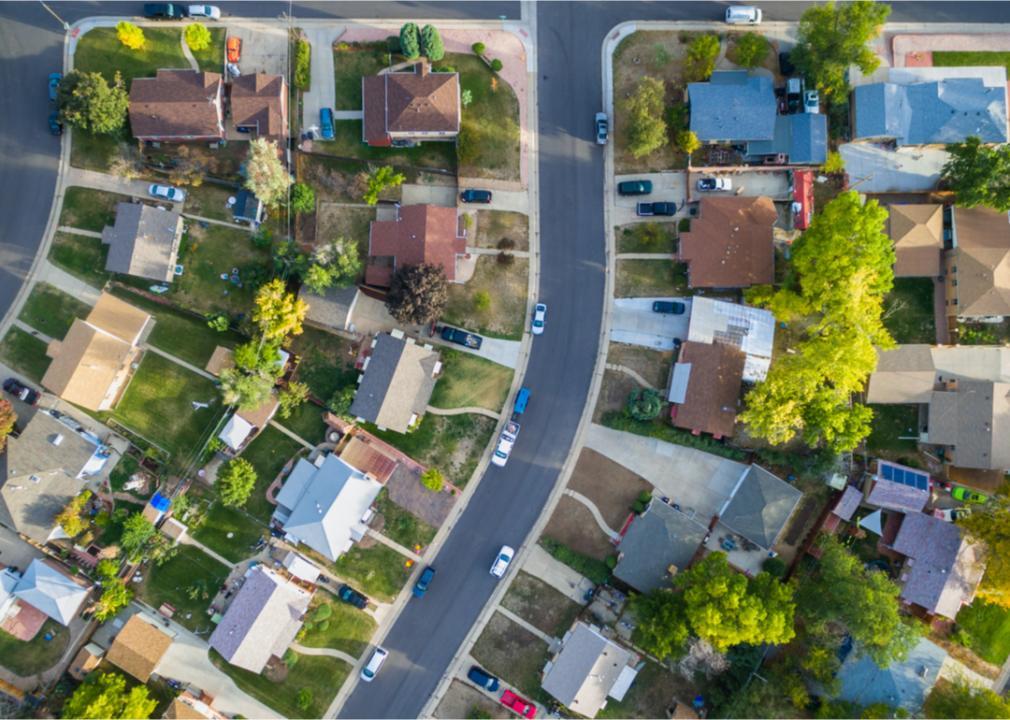
Counties with the most renters in Texas
All cities are made up of a mix of homeowners and renters, with 58.6% of Americans owning their own homes and 30.4% rending in the fourth quarter of 2020, according to the American Census Bureau. In cities, there tend to be higher rates of renters due to high property values and influxes of young people who flock to urban areas after college to enter the workforce.
Stacker compiled a list of the counties with most renters in Texas using data from the U.S. Census Bureau. Counties are ranked by percent of housing units occupied by renters as of 2019 5-year estimates. Keep reading to see if your county made the list.
You may also like:
Counties in Texas with the most car repair shops
#30. Hays County
- Housing units occupied by renters: 37.7%
- 2019 median gross rent: $1,154 (+18.6% change in rent since 2015)
--- #10 highest rent among counties in Texas, #212 among all counties nationwide
- Renters paying over 35% of household income: 44.4%
--- #33 most common among counties in Texas, #377 among all counties nationwide
- 2019 median gross rent: $1,154 (+18.6% change in rent since 2015)
--- #10 highest rent among counties in Texas, #212 among all counties nationwide
- Renters paying over 35% of household income: 44.4%
--- #33 most common among counties in Texas, #377 among all counties nationwide
#29. Webb County
- Housing units occupied by renters: 37.8%
- 2019 median gross rent: $844 (+11.3% change in rent since 2015)
--- #75 highest rent among counties in Texas, #806 among all counties nationwide
- Renters paying over 35% of household income: 45.0%
--- #31 most common among counties in Texas, #334 among all counties nationwide
- 2019 median gross rent: $844 (+11.3% change in rent since 2015)
--- #75 highest rent among counties in Texas, #806 among all counties nationwide
- Renters paying over 35% of household income: 45.0%
--- #31 most common among counties in Texas, #334 among all counties nationwide
#28. Brooks County
- Housing units occupied by renters: 38.7%
- 2019 median gross rent: $611 (+13.6% change in rent since 2015)
--- #216 highest rent among counties in Texas, #2,556 among all counties nationwide
- Renters paying over 35% of household income: 38.7%
--- #80 most common among counties in Texas, #1,021 among all counties nationwide
- 2019 median gross rent: $611 (+13.6% change in rent since 2015)
--- #216 highest rent among counties in Texas, #2,556 among all counties nationwide
- Renters paying over 35% of household income: 38.7%
--- #80 most common among counties in Texas, #1,021 among all counties nationwide
#27. El Paso County
- Housing units occupied by renters: 38.9%
- 2019 median gross rent: $838 (+11.7% change in rent since 2015)
--- #79 highest rent among counties in Texas, #825 among all counties nationwide
- Renters paying over 35% of household income: 40.0%
--- #66 most common among counties in Texas, #849 among all counties nationwide
- 2019 median gross rent: $838 (+11.7% change in rent since 2015)
--- #79 highest rent among counties in Texas, #825 among all counties nationwide
- Renters paying over 35% of household income: 40.0%
--- #66 most common among counties in Texas, #849 among all counties nationwide
#26. Jefferson County
- Housing units occupied by renters: 38.9%
- 2019 median gross rent: $871 (+14.5% change in rent since 2015)
--- #61 highest rent among counties in Texas, #708 among all counties nationwide
- Renters paying over 35% of household income: 37.2%
--- #98 most common among counties in Texas, #1,259 among all counties nationwide
- 2019 median gross rent: $871 (+14.5% change in rent since 2015)
--- #61 highest rent among counties in Texas, #708 among all counties nationwide
- Renters paying over 35% of household income: 37.2%
--- #98 most common among counties in Texas, #1,259 among all counties nationwide
You may also like:
Fastest-growing jobs in Texas
#25. Wilbarger County
- Housing units occupied by renters: 39.3%
- 2019 median gross rent: $616 (+12.2% change in rent since 2015)
--- #215 highest rent among counties in Texas, #2,519 among all counties nationwide
- Renters paying over 35% of household income: 25.3%
--- #209 most common among counties in Texas, #2,728 among all counties nationwide
- 2019 median gross rent: $616 (+12.2% change in rent since 2015)
--- #215 highest rent among counties in Texas, #2,519 among all counties nationwide
- Renters paying over 35% of household income: 25.3%
--- #209 most common among counties in Texas, #2,728 among all counties nationwide
#24. Tarrant County
- Housing units occupied by renters: 39.5%
- 2019 median gross rent: $1,095 (+19.9% change in rent since 2015)
--- #15 highest rent among counties in Texas, #276 among all counties nationwide
- Renters paying over 35% of household income: 37.6%
--- #94 most common among counties in Texas, #1,187 among all counties nationwide
- 2019 median gross rent: $1,095 (+19.9% change in rent since 2015)
--- #15 highest rent among counties in Texas, #276 among all counties nationwide
- Renters paying over 35% of household income: 37.6%
--- #94 most common among counties in Texas, #1,187 among all counties nationwide
#23. Wichita County
- Housing units occupied by renters: 39.7%
- 2019 median gross rent: $797 (+8.0% change in rent since 2015)
--- #106 highest rent among counties in Texas, #1,008 among all counties nationwide
- Renters paying over 35% of household income: 39.4%
--- #70 most common among counties in Texas, #924 among all counties nationwide
- 2019 median gross rent: $797 (+8.0% change in rent since 2015)
--- #106 highest rent among counties in Texas, #1,008 among all counties nationwide
- Renters paying over 35% of household income: 39.4%
--- #70 most common among counties in Texas, #924 among all counties nationwide
#22. Childress County
- Housing units occupied by renters: 40.1%
- 2019 median gross rent: $745 (+6.1% change in rent since 2015)
--- #144 highest rent among counties in Texas, #1,340 among all counties nationwide
- Renters paying over 35% of household income: 27.6%
--- #192 most common among counties in Texas, #2,544 among all counties nationwide
- 2019 median gross rent: $745 (+6.1% change in rent since 2015)
--- #144 highest rent among counties in Texas, #1,340 among all counties nationwide
- Renters paying over 35% of household income: 27.6%
--- #192 most common among counties in Texas, #2,544 among all counties nationwide
#21. McLennan County
- Housing units occupied by renters: 40.8%
- 2019 median gross rent: $871 (+13.9% change in rent since 2015)
--- #61 highest rent among counties in Texas, #708 among all counties nationwide
- Renters paying over 35% of household income: 43.8%
--- #36 most common among counties in Texas, #425 among all counties nationwide
- 2019 median gross rent: $871 (+13.9% change in rent since 2015)
--- #61 highest rent among counties in Texas, #708 among all counties nationwide
- Renters paying over 35% of household income: 43.8%
--- #36 most common among counties in Texas, #425 among all counties nationwide
You may also like:
Best counties to raise a family in Texas
#20. Gregg County
- Housing units occupied by renters: 40.9%
- 2019 median gross rent: $855 (+10.9% change in rent since 2015)
--- #69 highest rent among counties in Texas, #759 among all counties nationwide
- Renters paying over 35% of household income: 38.3%
--- #86 most common among counties in Texas, #1,079 among all counties nationwide
- 2019 median gross rent: $855 (+10.9% change in rent since 2015)
--- #69 highest rent among counties in Texas, #759 among all counties nationwide
- Renters paying over 35% of household income: 38.3%
--- #86 most common among counties in Texas, #1,079 among all counties nationwide
#19. Bexar County
- Housing units occupied by renters: 41.5%
- 2019 median gross rent: $1,015 (+15.9% change in rent since 2015)
--- #26 highest rent among counties in Texas, #380 among all counties nationwide
- Renters paying over 35% of household income: 40.5%
--- #60 most common among counties in Texas, #777 among all counties nationwide
- 2019 median gross rent: $1,015 (+15.9% change in rent since 2015)
--- #26 highest rent among counties in Texas, #380 among all counties nationwide
- Renters paying over 35% of household income: 40.5%
--- #60 most common among counties in Texas, #777 among all counties nationwide
#18. Taylor County
- Housing units occupied by renters: 41.6%
- 2019 median gross rent: $925 (+18.9% change in rent since 2015)
--- #39 highest rent among counties in Texas, #555 among all counties nationwide
- Renters paying over 35% of household income: 38.3%
--- #86 most common among counties in Texas, #1,079 among all counties nationwide
- 2019 median gross rent: $925 (+18.9% change in rent since 2015)
--- #39 highest rent among counties in Texas, #555 among all counties nationwide
- Renters paying over 35% of household income: 38.3%
--- #86 most common among counties in Texas, #1,079 among all counties nationwide
#17. Nueces County
- Housing units occupied by renters: 42.0%
- 2019 median gross rent: $1,017 (+14.7% change in rent since 2015)
--- #25 highest rent among counties in Texas, #379 among all counties nationwide
- Renters paying over 35% of household income: 38.7%
--- #80 most common among counties in Texas, #1,021 among all counties nationwide
- 2019 median gross rent: $1,017 (+14.7% change in rent since 2015)
--- #25 highest rent among counties in Texas, #379 among all counties nationwide
- Renters paying over 35% of household income: 38.7%
--- #80 most common among counties in Texas, #1,021 among all counties nationwide
#16. Coryell County
- Housing units occupied by renters: 42.1%
- 2019 median gross rent: $918 (-0.3% change in rent since 2015)
--- #42 highest rent among counties in Texas, #572 among all counties nationwide
- Renters paying over 35% of household income: 34.9%
--- #122 most common among counties in Texas, #1,645 among all counties nationwide
- 2019 median gross rent: $918 (-0.3% change in rent since 2015)
--- #42 highest rent among counties in Texas, #572 among all counties nationwide
- Renters paying over 35% of household income: 34.9%
--- #122 most common among counties in Texas, #1,645 among all counties nationwide
You may also like:
How to Start an LLC in Texas: 2025 Guide
#15. Brewster County
- Housing units occupied by renters: 42.2%
- 2019 median gross rent: $703 (+13.9% change in rent since 2015)
--- #179 highest rent among counties in Texas, #1,673 among all counties nationwide
- Renters paying over 35% of household income: 34.5%
--- #127 most common among counties in Texas, #1,703 among all counties nationwide
- 2019 median gross rent: $703 (+13.9% change in rent since 2015)
--- #179 highest rent among counties in Texas, #1,673 among all counties nationwide
- Renters paying over 35% of household income: 34.5%
--- #127 most common among counties in Texas, #1,703 among all counties nationwide
#14. Presidio County
- Housing units occupied by renters: 42.2%
- 2019 median gross rent: $429 (+0.2% change in rent since 2015)
--- #248 highest rent among counties in Texas, #3,119 among all counties nationwide
- Renters paying over 35% of household income: 28.7%
--- #187 most common among counties in Texas, #2,434 among all counties nationwide
- 2019 median gross rent: $429 (+0.2% change in rent since 2015)
--- #248 highest rent among counties in Texas, #3,119 among all counties nationwide
- Renters paying over 35% of household income: 28.7%
--- #187 most common among counties in Texas, #2,434 among all counties nationwide
#13. Nacogdoches County
- Housing units occupied by renters: 43.4%
- 2019 median gross rent: $768 (+5.2% change in rent since 2015)
--- #124 highest rent among counties in Texas, #1,189 among all counties nationwide
- Renters paying over 35% of household income: 47.8%
--- #18 most common among counties in Texas, #179 among all counties nationwide
- 2019 median gross rent: $768 (+5.2% change in rent since 2015)
--- #124 highest rent among counties in Texas, #1,189 among all counties nationwide
- Renters paying over 35% of household income: 47.8%
--- #18 most common among counties in Texas, #179 among all counties nationwide
#12. Cottle County
- Housing units occupied by renters: 43.8%
- 2019 median gross rent: $340 (+23.6% change in rent since 2015)
--- #251 highest rent among counties in Texas, #3,135 among all counties nationwide
- Renters paying over 35% of household income: 38.4%
--- #84 most common among counties in Texas, #1,069 among all counties nationwide
- 2019 median gross rent: $340 (+23.6% change in rent since 2015)
--- #251 highest rent among counties in Texas, #3,135 among all counties nationwide
- Renters paying over 35% of household income: 38.4%
--- #84 most common among counties in Texas, #1,069 among all counties nationwide
#11. Lubbock County
- Housing units occupied by renters: 44.8%
- 2019 median gross rent: $940 (+15.9% change in rent since 2015)
--- #36 highest rent among counties in Texas, #521 among all counties nationwide
- Renters paying over 35% of household income: 45.2%
--- #29 most common among counties in Texas, #323 among all counties nationwide
- 2019 median gross rent: $940 (+15.9% change in rent since 2015)
--- #36 highest rent among counties in Texas, #521 among all counties nationwide
- Renters paying over 35% of household income: 45.2%
--- #29 most common among counties in Texas, #323 among all counties nationwide
You may also like:
Highest-rated Class of 2025 football recruits from Texas
#10. Potter County
- Housing units occupied by renters: 44.8%
- 2019 median gross rent: $803 (+12.2% change in rent since 2015)
--- #103 highest rent among counties in Texas, #977 among all counties nationwide
- Renters paying over 35% of household income: 42.0%
--- #51 most common among counties in Texas, #604 among all counties nationwide
- 2019 median gross rent: $803 (+12.2% change in rent since 2015)
--- #103 highest rent among counties in Texas, #977 among all counties nationwide
- Renters paying over 35% of household income: 42.0%
--- #51 most common among counties in Texas, #604 among all counties nationwide
#9. Harris County
- Housing units occupied by renters: 45.4%
- 2019 median gross rent: $1,078 (+19.0% change in rent since 2015)
--- #16 highest rent among counties in Texas, #293 among all counties nationwide
- Renters paying over 35% of household income: 40.8%
--- #57 most common among counties in Texas, #738 among all counties nationwide
- 2019 median gross rent: $1,078 (+19.0% change in rent since 2015)
--- #16 highest rent among counties in Texas, #293 among all counties nationwide
- Renters paying over 35% of household income: 40.8%
--- #57 most common among counties in Texas, #738 among all counties nationwide
#8. Bell County
- Housing units occupied by renters: 45.7%
- 2019 median gross rent: $927 (+7.7% change in rent since 2015)
--- #38 highest rent among counties in Texas, #547 among all counties nationwide
- Renters paying over 35% of household income: 36.2%
--- #108 most common among counties in Texas, #1,445 among all counties nationwide
- 2019 median gross rent: $927 (+7.7% change in rent since 2015)
--- #38 highest rent among counties in Texas, #547 among all counties nationwide
- Renters paying over 35% of household income: 36.2%
--- #108 most common among counties in Texas, #1,445 among all counties nationwide
#7. Kleberg County
- Housing units occupied by renters: 47.2%
- 2019 median gross rent: $859 (+15.3% change in rent since 2015)
--- #67 highest rent among counties in Texas, #742 among all counties nationwide
- Renters paying over 35% of household income: 42.9%
--- #45 most common among counties in Texas, #507 among all counties nationwide
- 2019 median gross rent: $859 (+15.3% change in rent since 2015)
--- #67 highest rent among counties in Texas, #742 among all counties nationwide
- Renters paying over 35% of household income: 42.9%
--- #45 most common among counties in Texas, #507 among all counties nationwide
#6. Travis County
- Housing units occupied by renters: 47.6%
- 2019 median gross rent: $1,289 (+22.3% change in rent since 2015)
--- #5 highest rent among counties in Texas, #123 among all counties nationwide
- Renters paying over 35% of household income: 37.8%
--- #90 most common among counties in Texas, #1,154 among all counties nationwide
- 2019 median gross rent: $1,289 (+22.3% change in rent since 2015)
--- #5 highest rent among counties in Texas, #123 among all counties nationwide
- Renters paying over 35% of household income: 37.8%
--- #90 most common among counties in Texas, #1,154 among all counties nationwide
You may also like:
How gas prices have changed in Texas in the last week
#5. Walker County
- Housing units occupied by renters: 48.6%
- 2019 median gross rent: $908 (+15.5% change in rent since 2015)
--- #47 highest rent among counties in Texas, #597 among all counties nationwide
- Renters paying over 35% of household income: 51.7%
--- #9 most common among counties in Texas, #76 among all counties nationwide
- 2019 median gross rent: $908 (+15.5% change in rent since 2015)
--- #47 highest rent among counties in Texas, #597 among all counties nationwide
- Renters paying over 35% of household income: 51.7%
--- #9 most common among counties in Texas, #76 among all counties nationwide
#4. Dallas County
- Housing units occupied by renters: 50.0%
- 2019 median gross rent: $1,105 (+21.8% change in rent since 2015)
--- #14 highest rent among counties in Texas, #266 among all counties nationwide
- Renters paying over 35% of household income: 37.4%
--- #96 most common among counties in Texas, #1,220 among all counties nationwide
- 2019 median gross rent: $1,105 (+21.8% change in rent since 2015)
--- #14 highest rent among counties in Texas, #266 among all counties nationwide
- Renters paying over 35% of household income: 37.4%
--- #96 most common among counties in Texas, #1,220 among all counties nationwide
#3. Brazos County
- Housing units occupied by renters: 52.9%
- 2019 median gross rent: $948 (+10.1% change in rent since 2015)
--- #33 highest rent among counties in Texas, #504 among all counties nationwide
- Renters paying over 35% of household income: 51.8%
--- #8 most common among counties in Texas, #74 among all counties nationwide
- 2019 median gross rent: $948 (+10.1% change in rent since 2015)
--- #33 highest rent among counties in Texas, #504 among all counties nationwide
- Renters paying over 35% of household income: 51.8%
--- #8 most common among counties in Texas, #74 among all counties nationwide
#2. King County
- Housing units occupied by renters: 66.2%
- 2019 median gross rent: $658 (-11.4% change in rent since 2015)
--- #197 highest rent among counties in Texas, #2,116 among all counties nationwide
- Renters paying over 35% of household income: 54.5%
--- #5 most common among counties in Texas, #31 among all counties nationwide
- 2019 median gross rent: $658 (-11.4% change in rent since 2015)
--- #197 highest rent among counties in Texas, #2,116 among all counties nationwide
- Renters paying over 35% of household income: 54.5%
--- #5 most common among counties in Texas, #31 among all counties nationwide
#1. Kenedy County
- Housing units occupied by renters: 76.6%
- 2019 median gross rent: $533 (-4.5% change in rent since 2015)
--- #237 highest rent among counties in Texas, #2,965 among all counties nationwide
- Renters paying over 35% of household income: 0.0%
--- #249 most common among counties in Texas, #3,132 among all counties nationwide
- 2019 median gross rent: $533 (-4.5% change in rent since 2015)
--- #237 highest rent among counties in Texas, #2,965 among all counties nationwide
- Renters paying over 35% of household income: 0.0%
--- #249 most common among counties in Texas, #3,132 among all counties nationwide
You may also like:
The 20 most affordable cities in Texas to buy a house


