Nearly half of Americans live with high blood pressure. High blood pressure, or hypertension, contributed to nearly 700,000 deaths in 2021 and is a major risk factor for heart disease and stroke.
Stacker used data from the Centers for Disease Control and Prevention to examine the counties with the highest rates of high blood pressure in Virginia as of 2021. Ties are broken by the share of the population on blood pressure medication. For counties that ranked in the top 200 nationally, their national rank for high blood pressure prevalence is also included.
The Southeast has the highest rates of high blood pressure. Racial disparities underscore these geographical trends, as about 40% of Black people across the U.S. have high blood pressure. Social determinants of health, including access to health care and fresh foods, have contributed to higher rates.
Guidelines for doctors have also limited the types of high blood pressure medication available to Black patients, a paradigm which is now starting to shift as recent studies have pointed out the flaws of race-based prescribing for hypertension.
You may also like: Highest-rated museums in Virginia by visitors
Emma Rubin // Stacker
1 / 26State-level statistics
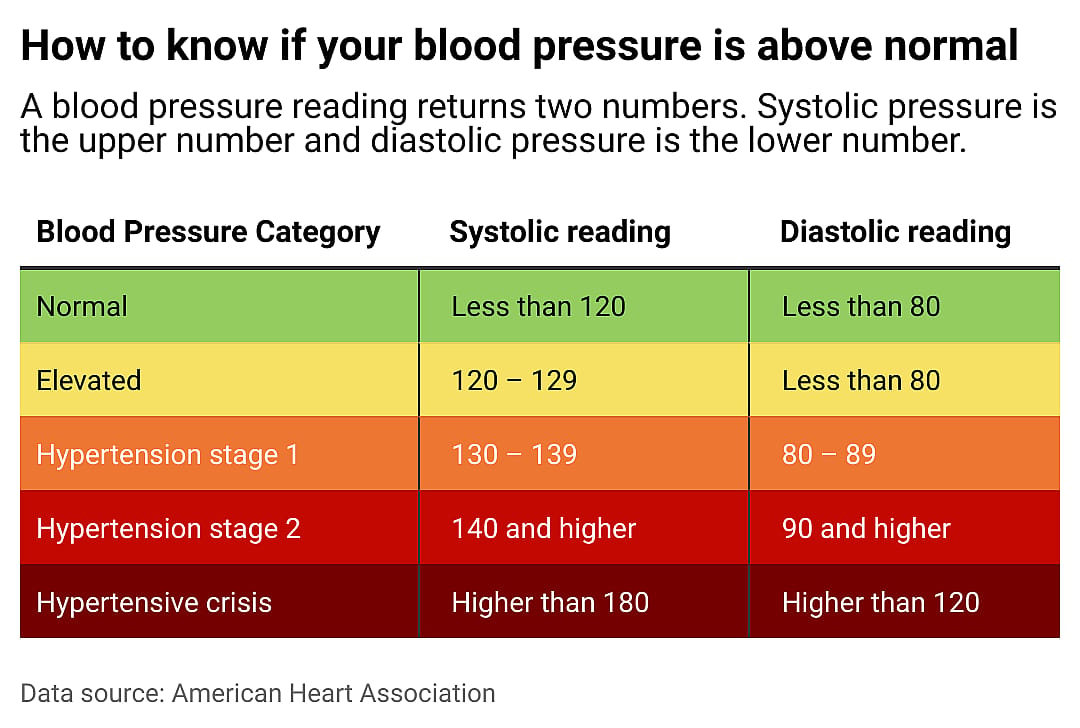
The American Heart Association and the American College of Cardiology in 2017 updated high blood pressure guidelines for the first time since 2003. Any reading of 130/80 and above is now considered hypertensive.
Blood pressure is measured using two numbers: systolic and diastolic pressure. The systolic reading examines the arteries when the heart is beating, while the diastolic reading examines them while the heart rests. Normal blood pressure is below 120/80.
Diet is a major driver of high blood pressure, with salty foods and low-potassium diets connected to hypertension. Other lifestyle choices play a part, too, including drinking and smoking. The CDC says heredity also likely plays some role in hypertension risk.
For people who have hypertension, limiting high-risk foods and behaviors, taking medication recommended by doctors, and regularly monitoring their blood pressure with a cuff can prevent more severe incidents.
Read on to see the counties in Virginia with the highest rates of hypertension.
Erin Cadigan // Shutterstock
2 / 26#25. Richmond County
- Adults with high blood pressure: 36.8%
- Adults on medication for high blood pressure: 23.0% (62.6% of those with high blood pressure)
#24. Buchanan County
- Adults with high blood pressure: 36.8%
- Adults on medication for high blood pressure: 23.1% (62.9% of those with high blood pressure)
#23. Accomack County
- Adults with high blood pressure: 36.8%
- Adults on medication for high blood pressure: 23.8% (64.7% of those with high blood pressure)
Timothy L Barnes // Shutterstock
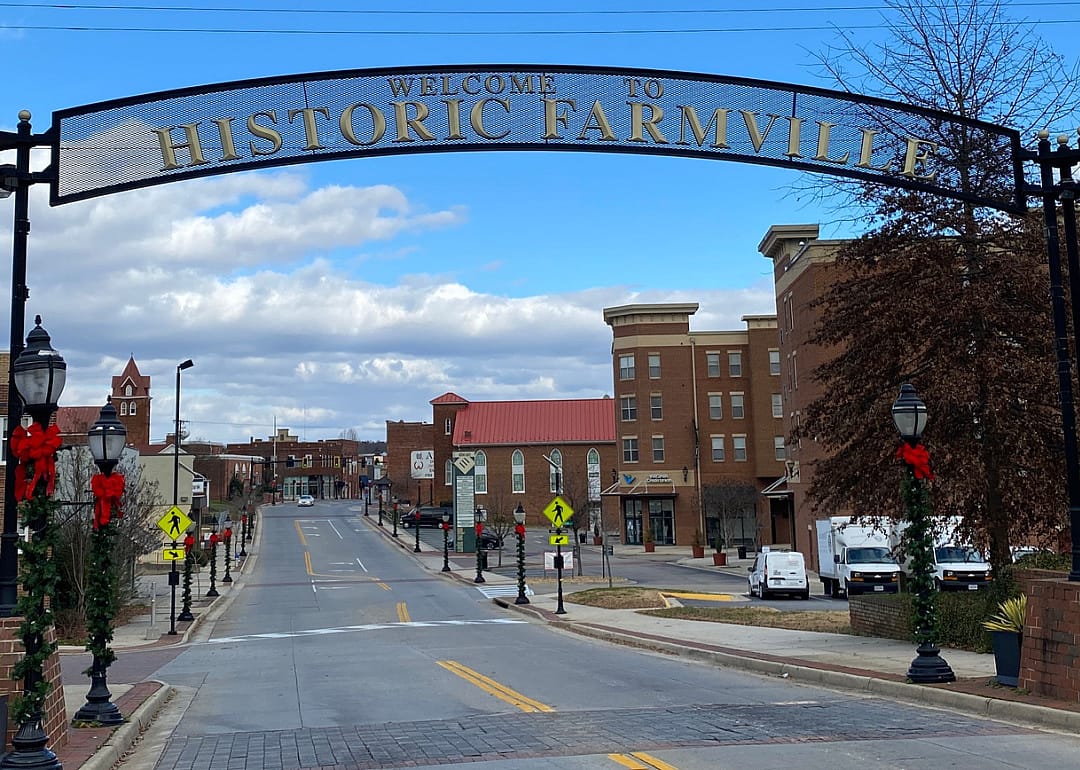
5 / 26#21. Mecklenburg County
- Adults with high blood pressure: 37.5%
- Adults on medication for high blood pressure: 24.3% (64.7% of those with high blood pressure)
Lekali Studio // Shutterstock
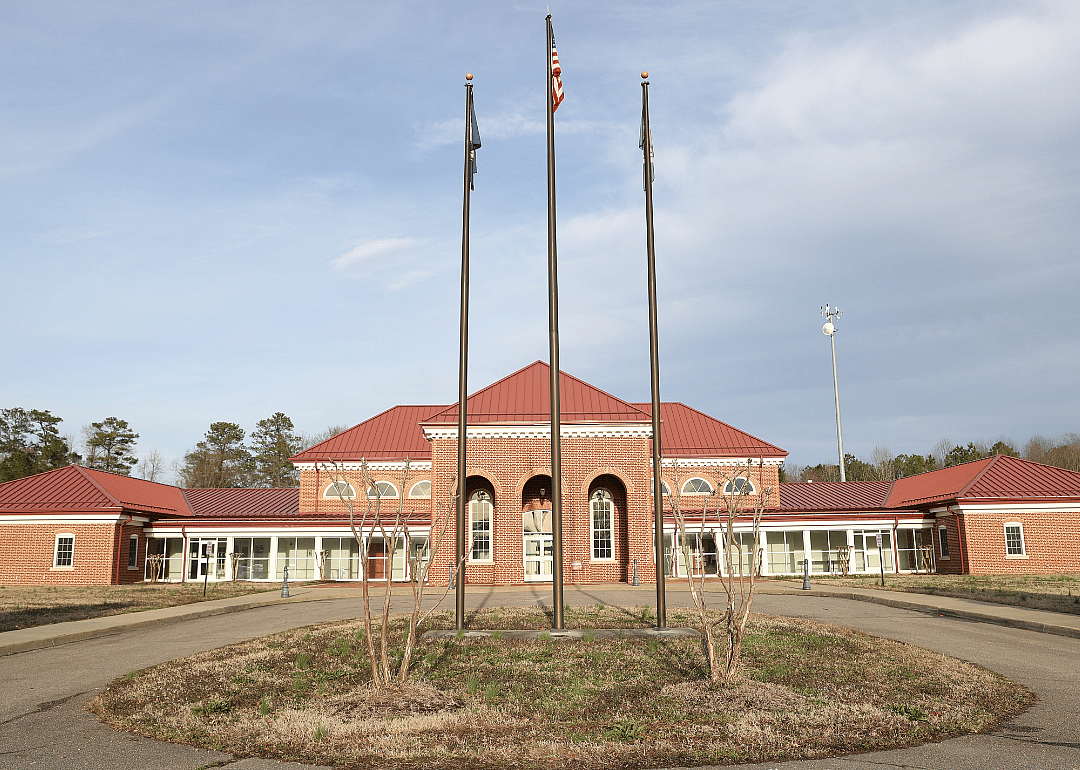
7 / 26#20. Prince Edward County
- Adults with high blood pressure: 37.6%
- Adults on medication for high blood pressure: 24.1% (64.1% of those with high blood pressure)
Jeffery L Willis // Shutterstock
8 / 26#19. Lee County
- Adults with high blood pressure: 37.9%
- Adults on medication for high blood pressure: 24.0% (63.3% of those with high blood pressure)
OJUP // Shutterstock
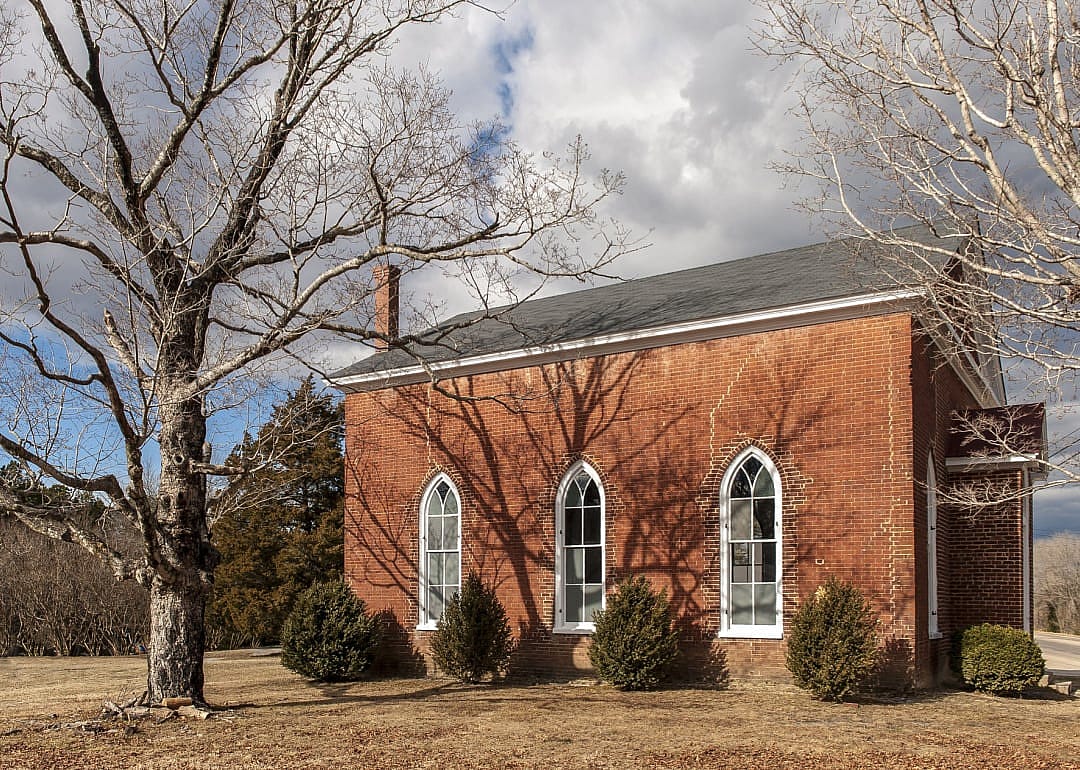
9 / 26#18. Charles City County
- Adults with high blood pressure: 37.9%
- Adults on medication for high blood pressure: 24.1% (63.5% of those with high blood pressure)
#16. Essex County
- Adults with high blood pressure: 38.1%
- Adults on medication for high blood pressure: 24.5% (64.3% of those with high blood pressure)
Kyle J Little // Shutterstock
12 / 26#15. Hampton County
- Adults with high blood pressure: 38.1%
- Adults on medication for high blood pressure: 25.0% (65.6% of those with high blood pressure)
Joseph Sohm // // Shutterstock
13 / 26#14. Buckingham County
- Adults with high blood pressure: 38.6%
- Adults on medication for high blood pressure: 24.7% (63.9% of those with high blood pressure)
#13. Lunenburg County
- Adults with high blood pressure: 38.8%
- Adults on medication for high blood pressure: 24.8% (64.0% of those with high blood pressure)
Don Williamson // Shutterstock
15 / 26OJUP // Shutterstock
16 / 26#11. Hopewell County
- Adults with high blood pressure: 39.1%
- Adults on medication for high blood pressure: 25.6% (65.4% of those with high blood pressure)
#10. Newport News County
- Adults with high blood pressure: 39.5%
- Adults on medication for high blood pressure: 25.5% (64.5% of those with high blood pressure)
#9. Franklin City County
- Adults with high blood pressure: 40.0%
- Adults on medication for high blood pressure: 26.5% (66.2% of those with high blood pressure)
#8. Brunswick County
- Adults with high blood pressure: 40.3%
- Adults on medication for high blood pressure: 26.4% (65.5% of those with high blood pressure)
#6. Martinsville County
- Adults with high blood pressure: 40.3%
- Adults on medication for high blood pressure: 26.8% (66.4% of those with high blood pressure)
#5. Sussex County
- Adults with high blood pressure: 40.8% (#179 highest nationally)
- Adults on medication for high blood pressure: 26.3% (64.4% of those with high blood pressure)
Bryan Pollard // Shutterstock
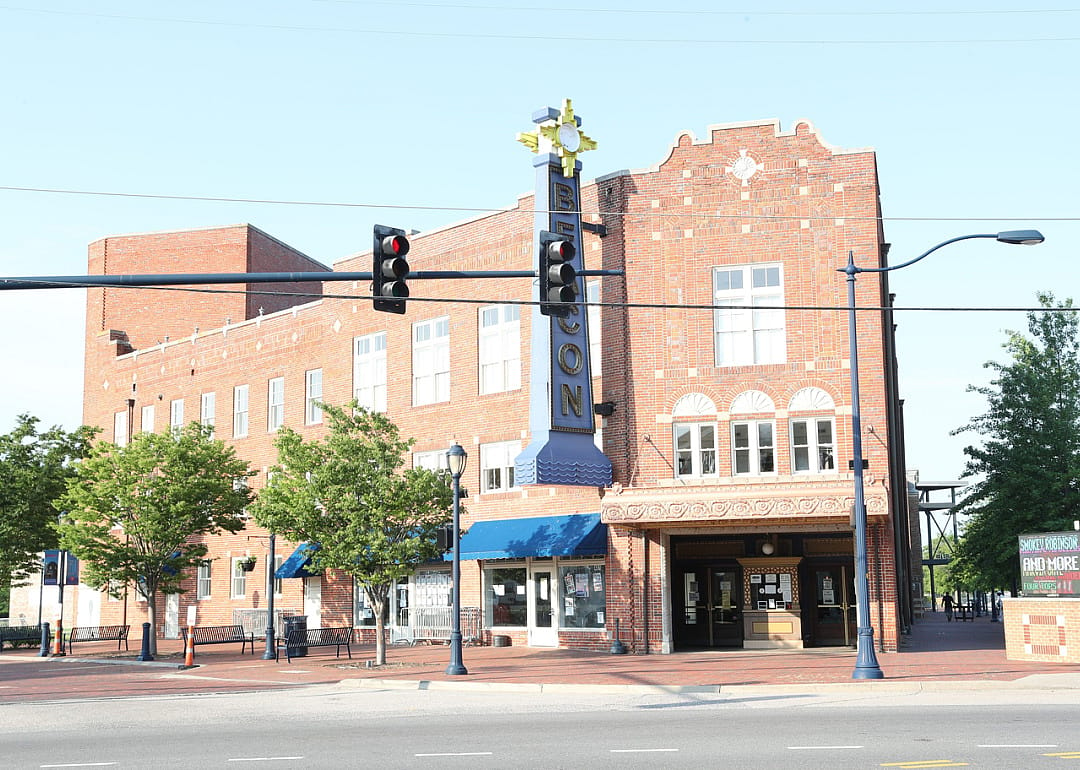
23 / 26#4. Danville County
- Adults with high blood pressure: 41.3% (#152 highest nationally)
- Adults on medication for high blood pressure: 27.5% (66.7% of those with high blood pressure)
Wileydoc // Shutterstock
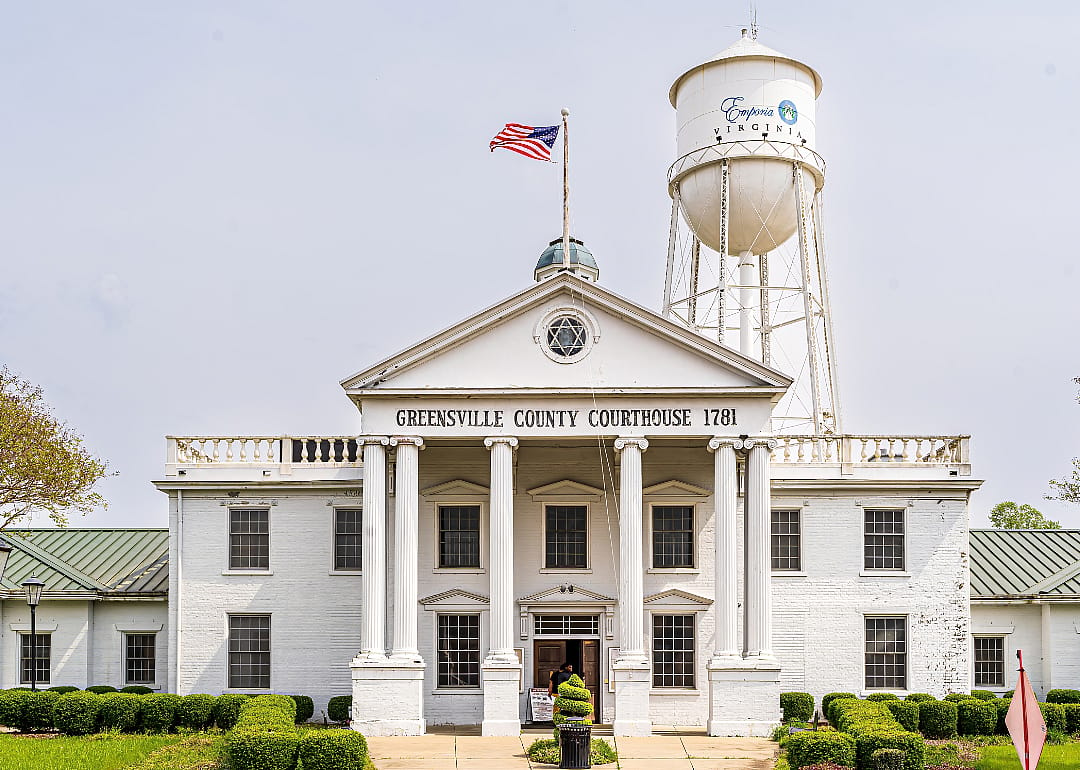
24 / 26#3. Greensville County
- Adults with high blood pressure: 42.1% (#120 highest nationally)
- Adults on medication for high blood pressure: 27.4% (65.0% of those with high blood pressure)
Wileydoc // Shutterstock
25 / 26#2. Emporia County
- Adults with high blood pressure: 43.7% (#69 highest nationally)
- Adults on medication for high blood pressure: 29.6% (67.7% of those with high blood pressure)
You may also like: Coldest Novembers in Virginia since 1895
OJUP // Shutterstock
26 / 26#1. Petersburg County
- Adults with high blood pressure: 45.3% (#41 highest nationally)
- Adults on medication for high blood pressure: 30.5% (67.4% of those with high blood pressure)
This story features data reporting and writing by Emma Rubin and is part of a series utilizing data automation across 49 states.