randy andy // Shutterstock
1 / 51#51. Nevada
- Bridges per 100 miles of public road: 4.4
- Total bridges: 2,067
- Share of bridges in poor condition: 1.2%

Bridges can be exciting pieces of infrastructure that connect otherwise distant places. New York City's Manhattan Island is connected to the rest of the country by 21 bridges. On the opposite coast, Greater Seattle is home to four of the longest floating bridges in the world, and San Francisco's Golden Gate Bridge is considered a national icon. However, bridges can also cost billions to maintain, and states are responsible for repairing, replacing, and preserving them.
There are more than 600,000 bridges across the United States, with a concentration of about 14.7 bridges per 100 miles of public roadway, according to the bureau. TruckInfo.net identified the states with the most bridges per 100 miles of public road, using data from the Bureau of Transportation Statistics. Concentrations are based on public roadway miles and bridge counts as of 2021, the latest year when both measures were recorded. The analysis also includes Federal Highway Administration data on 2023 bridge conditions, which don't factor into the rankings. A bridge, under federal regulations, is defined as a vehicle-carrying span at least 20 feet long that passes over a lower area of terrain or an obstruction, such as a waterway, railroad track, or other road.
Most of these structures aren't of the awe-inspiring variety. Most commonly, bridges are present throughout interstate and highway systems, connecting major roadways and allowing major roads and city streets to cross each other without complicated intersections. They also carry even small roads over dips in the landscape, rivers, creeks, and brooks. American motorists pass over bridges about five billion times per day, largely without a second thought.
Bridges are more concentrated in the Northeast, Midwest, and Southern regions of the U.S. The Northeast has the highest population density in the country, necessitating roadway bridges to allow a more concentrated populace to get from place to place. As the earliest region to be urbanized, the Northeast is also home to some of the oldest roadway bridges, some of which are crafted from stone.
Not all bridges benefit from that longevity. As of 2023, nearly 7% of bridges across the country are in poor condition, Federal Highway Administration data shows. Those rates are much higher in some parts of the country: In West Virginia, for example, nearly 1 in 5 bridges is in poor condition.
Repairs can be costly: Rebuilding the Bay Bridge connecting San Francisco and Oakland ended with a $6.5 billion price tag by the time the new and improved bridge opened in 2013. An American Road & Transportation Builders Association analysis found that about 1 in 3 U.S. bridges needs to be replaced or repaired in some way, with a total cost of $319 billion to complete them all.
Despite their challenges, the U.S. public roadway system couldn't function without its myriad bridges. Read on to see which states' roadways are most dependent on bridges.
randy andy // Shutterstock
1 / 51- Bridges per 100 miles of public road: 4.4
- Total bridges: 2,067
- Share of bridges in poor condition: 1.2%

Jacob Boomsma // Shutterstock
2 / 51- Bridges per 100 miles of public road: 4.8
- Total bridges: 4,285
- Share of bridges in poor condition: 10.6%

Sean Pavone // Shutterstock
3 / 51- Bridges per 100 miles of public road: 5.6
- Total bridges: 4,025
- Share of bridges in poor condition: 5.0%

Sean Pavone // Shutterstock
4 / 51- Bridges per 100 miles of public road: 6.2
- Total bridges: 3,056
- Share of bridges in poor condition: 2.4%

Mihai_Andritoiu // Shutterstock
5 / 51- Bridges per 100 miles of public road: 7.2
- Total bridges: 5,266
- Share of bridges in poor condition: 6.9%

JohnDSmith // Shutterstock
6 / 51- Bridges per 100 miles of public road: 7.2
- Total bridges: 5,886
- Share of bridges in poor condition: 16.7%

Charles Knowles // Shutterstock
7 / 51- Bridges per 100 miles of public road: 8.4
- Total bridges: 4,561
- Share of bridges in poor condition: 5.1%

Canva
8 / 51- Bridges per 100 miles of public road: 9.2
- Total bridges: 1,632
- Share of bridges in poor condition: 8.1%

Sean Pavone // Shutterstock
9 / 51- Bridges per 100 miles of public road: 9.2
- Total bridges: 11,284
- Share of bridges in poor condition: 11.4%

Canva
10 / 51- Bridges per 100 miles of public road: 9.4
- Total bridges: 13,496
- Share of bridges in poor condition: 4.3%
Canva
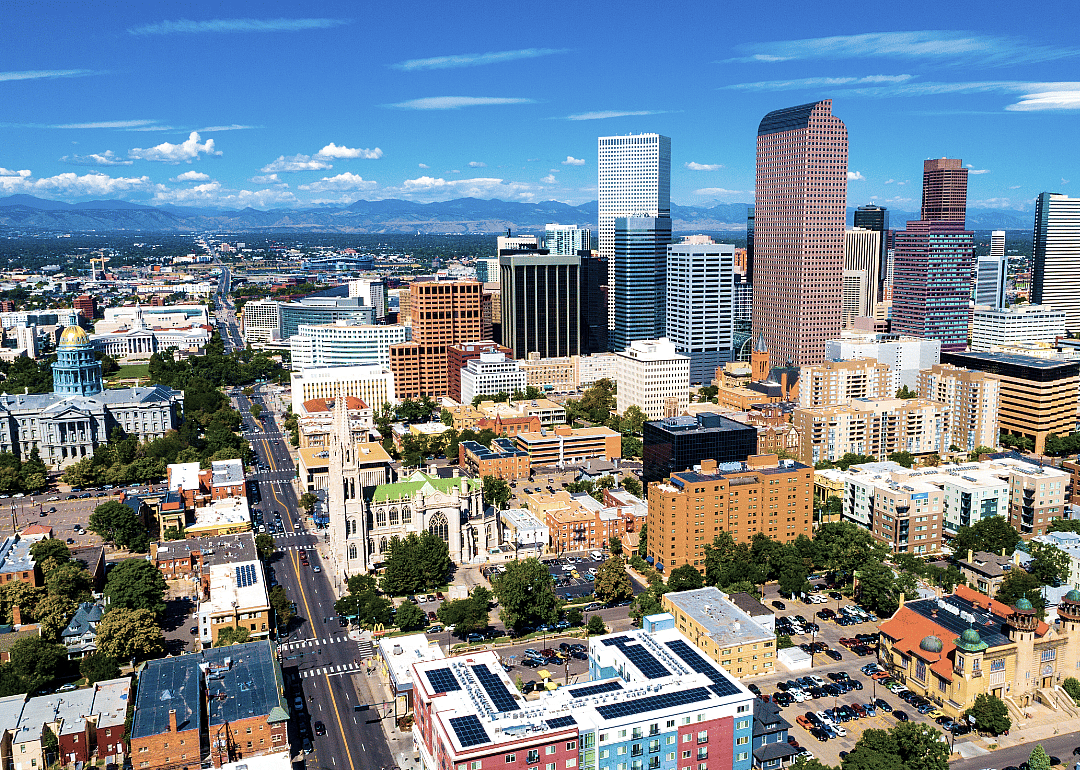
11 / 51- Bridges per 100 miles of public road: 9.9
- Total bridges: 8,869
- Share of bridges in poor condition: 4.9%

Mia2you // Shutterstock
12 / 51- Bridges per 100 miles of public road: 10.3
- Total bridges: 12,680
- Share of bridges in poor condition: 3.5%

LBill45 // Shutterstock
13 / 51- Bridges per 100 miles of public road: 10.4
- Total bridges: 3,114
- Share of bridges in poor condition: 6.5%

Sean Pavone // Shutterstock
14 / 51- Bridges per 100 miles of public road: 10.4
- Total bridges: 8,235
- Share of bridges in poor condition: 4.8%

Agnieszka Gaul // Shutterstock
15 / 51- Bridges per 100 miles of public road: 10.5
- Total bridges: 8,358
- Share of bridges in poor condition: 5.4%
Joseph Sohm // Shutterstock
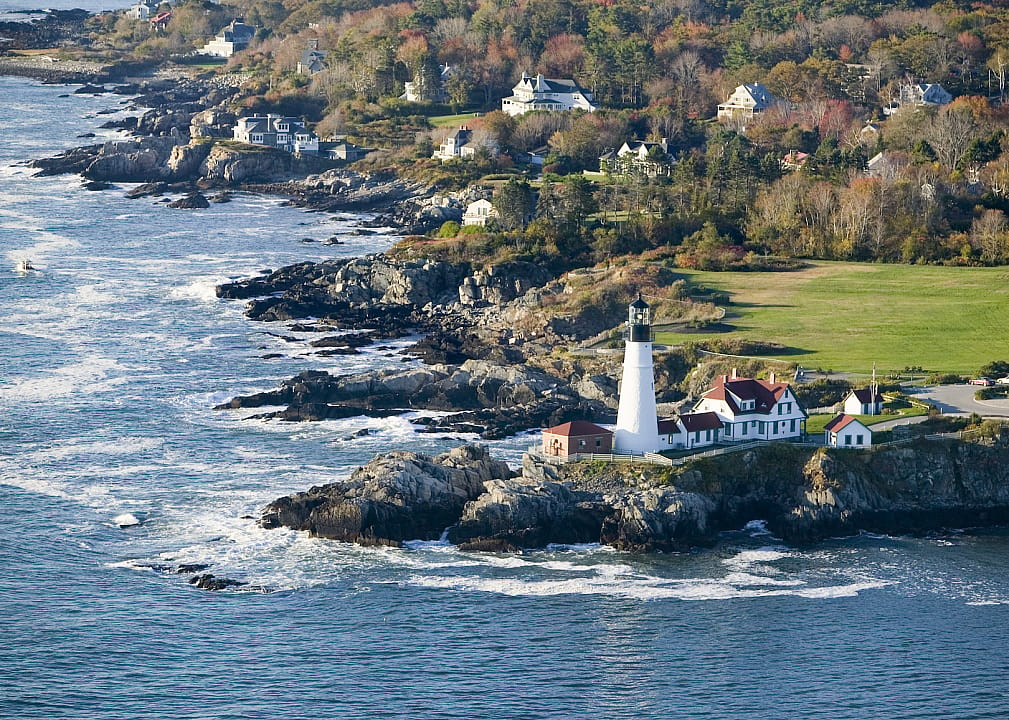
16 / 51- Bridges per 100 miles of public road: 10.9
- Total bridges: 2,485
- Share of bridges in poor condition: 14.8%

Sean Pavone // Shutterstock
17 / 51- Bridges per 100 miles of public road: 11.3
- Total bridges: 8,467
- Share of bridges in poor condition: 1.1%

f11photo // Shutterstock
18 / 51- Bridges per 100 miles of public road: 11.9
- Total bridges: 9,395
- Share of bridges in poor condition: 5.6%

Canva
19 / 51- Bridges per 100 miles of public road: 11.9
- Total bridges: 14,987
- Share of bridges in poor condition: 1.6%

Mihai_Andritoiu // Shutterstock
20 / 51- Bridges per 100 miles of public road: 12.4
- Total bridges: 14,307
- Share of bridges in poor condition: 6.5%

George Wirt // Shutterstock
21 / 51- Bridges per 100 miles of public road: 12.9
- Total bridges: 779
- Share of bridges in poor condition: 15.3%

Canva
22 / 51- Bridges per 100 miles of public road: 13.0
- Total bridges: 12,941
- Share of bridges in poor condition: 5.4%

Real Window Creative // Shutterstock
23 / 51- Bridges per 100 miles of public road: 13.4
- Total bridges: 875
- Share of bridges in poor condition: 1.3%

Sean Pavone // Shutterstock
24 / 51- Bridges per 100 miles of public road: 14.2
- Total bridges: 5,245
- Share of bridges in poor condition: 8.5%

Marek Masik // Shutterstock
25 / 51- Bridges per 100 miles of public road: 14.5
- Total bridges: 25,737
- Share of bridges in poor condition: 6.2%

Wangkun Jia // Shutterstock
26 / 51- Bridges per 100 miles of public road: 15.3
- Total bridges: 17,555
- Share of bridges in poor condition: 9.0%

Sean Pavone // Shutterstock
27 / 51- Bridges per 100 miles of public road: 15.6
- Total bridges: 2,527
- Share of bridges in poor condition: 7.6%

Katherine Welles // Shutterstock
28 / 51- Bridges per 100 miles of public road: 16.1
- Total bridges: 15,348
- Share of bridges in poor condition: 7.9%

Kevin Ruck // Shutterstock
29 / 51- Bridges per 100 miles of public road: 16.1
- Total bridges: 16,164
- Share of bridges in poor condition: 3.5%

f11photo // Shutterstock
30 / 51- Bridges per 100 miles of public road: 16.2
- Total bridges: 246
- Share of bridges in poor condition: 1.6%

Sean Pavone // Shutterstock
31 / 51- Bridges per 100 miles of public road: 16.8
- Total bridges: 5,446
- Share of bridges in poor condition: 4.6%

Sean Pavone // Shutterstock
32 / 51- Bridges per 100 miles of public road: 17.1
- Total bridges: 55,175
- Share of bridges in poor condition: 1.3%
Sharkshock // Shutterstock
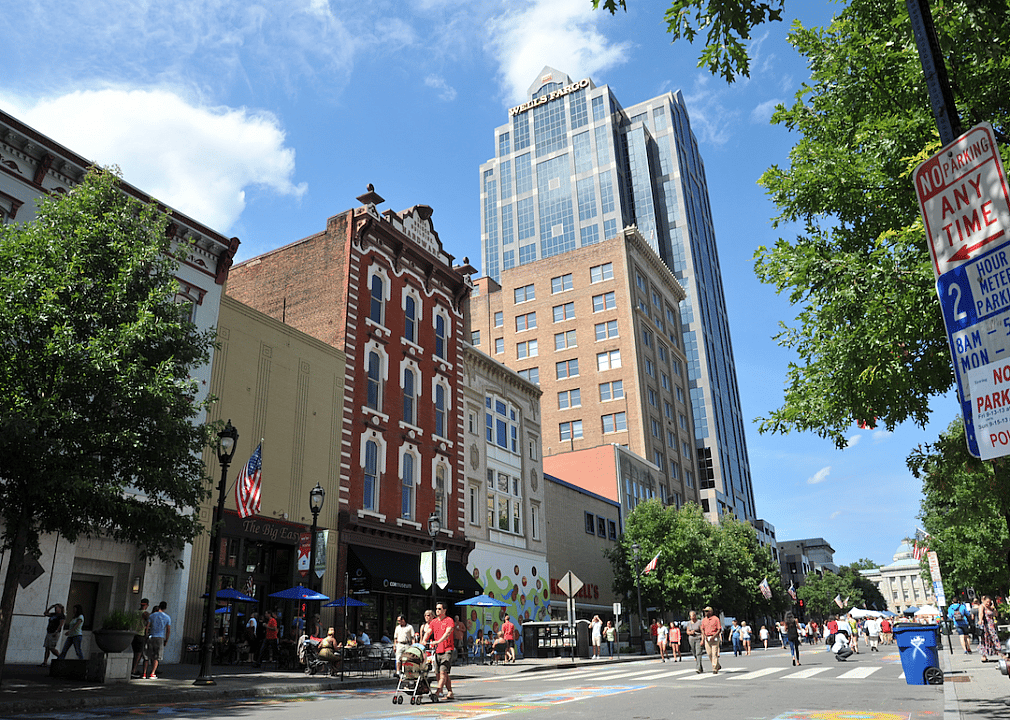
33 / 51- Bridges per 100 miles of public road: 17.5
- Total bridges: 18,877
- Share of bridges in poor condition: 7.1%

Mihai_Andritoiu // Shutterstock
34 / 51- Bridges per 100 miles of public road: 17.5
- Total bridges: 6,798
- Share of bridges in poor condition: 6.5%

Jacob Boomsma // Shutterstock
35 / 51- Bridges per 100 miles of public road: 17.9
- Total bridges: 24,925
- Share of bridges in poor condition: 5.2%

Rotorhead 30A Productions // Shutterstock
36 / 51- Bridges per 100 miles of public road: 18.0
- Total bridges: 14,410
- Share of bridges in poor condition: 7.0%

Sean Pavone // Shutterstock
37 / 51- Bridges per 100 miles of public road: 18.4
- Total bridges: 26,846
- Share of bridges in poor condition: 9.2%

Sean Pavone // Shutterstock
38 / 51- Bridges per 100 miles of public road: 18.5
- Total bridges: 13,997
- Share of bridges in poor condition: 3.5%

TommyBrison // Shutterstock
39 / 51- Bridges per 100 miles of public road: 18.5
- Total bridges: 24,590
- Share of bridges in poor condition: 9.0%

Sean Pavone // Shutterstock
40 / 51- Bridges per 100 miles of public road: 18.8
- Total bridges: 7,314
- Share of bridges in poor condition: 19.7%

ESB Professional // Shutterstock
41 / 51- Bridges per 100 miles of public road: 19.2
- Total bridges: 23,166
- Share of bridges in poor condition: 13.0%

Sean Pavone // Shutterstock
42 / 51- Bridges per 100 miles of public road: 19.4
- Total bridges: 12,782
- Share of bridges in poor condition: 12.1%

Sean Pavone // Shutterstock
43 / 51- Bridges per 100 miles of public road: 19.8
- Total bridges: 19,337
- Share of bridges in poor condition: 5.3%

Albert Pego // Shutterstock
44 / 51- Bridges per 100 miles of public road: 19.9
- Total bridges: 2,836
- Share of bridges in poor condition: 2.6%

Sean Pavone // Shutterstock
45 / 51- Bridges per 100 miles of public road: 20.1
- Total bridges: 23,220
- Share of bridges in poor condition: 7.9%

Sean Pavone // Shutterstock
46 / 51- Bridges per 100 miles of public road: 20.4
- Total bridges: 4,361
- Share of bridges in poor condition: 5.0%

Jacob Boomsma // Shutterstock
47 / 51- Bridges per 100 miles of public road: 20.8
- Total bridges: 23,870
- Share of bridges in poor condition: 19.2%

Kevin Ruck // Shutterstock
48 / 51- Bridges per 100 miles of public road: 21.1
- Total bridges: 20,331
- Share of bridges in poor condition: 4.4%

Canva
49 / 51- Bridges per 100 miles of public road: 21.7
- Total bridges: 16,788
- Share of bridges in poor condition: 6.3%

Canva
50 / 51- Bridges per 100 miles of public road: 22.1
- Total bridges: 27,151
- Share of bridges in poor condition: 4.6%

Canva
51 / 51- Bridges per 100 miles of public road: 25.7
- Total bridges: 1,162
- Share of bridges in poor condition: 6.7%
Data reporting by Paxtyn Merten. Story editing by Jeff Inglis. Copy editing by Tim Bruns. Photo selection by Clarese Moller.