5.1 million votes: See the demographics of Arizona's voting population
5.1 million votes: See the demographics of Arizona's voting population
In 2020, 158.4 million citizens—almost two-thirds of estimated eligible voters—voted in the presidential elections, according to the Pew Research Center. The number represented a higher than average turnout, with people voting in numbers not seen since 1980 and possibly well before.
Stacker compiled voter demographics for each state and Washington, D.C., using the 2019 U.S. Census Bureau's American Community Survey (released in September 2020). Each slide shows the state's voting-eligible population (citizens who are 18 or older) and the breakdown of that population by sex, age, race, and education. Economic statistics are not included because the American Community Survey does not account for COVID-19, which affected unemployment, poverty, and medical insurance status for millions of Americans. In order to avoid making any assumptions about the data or the participants of the American Community Survey, Stacker used the exact wording of the "race" and "sex" framework that was provided in the census data.
Keep reading to see the voter demographics of your state.
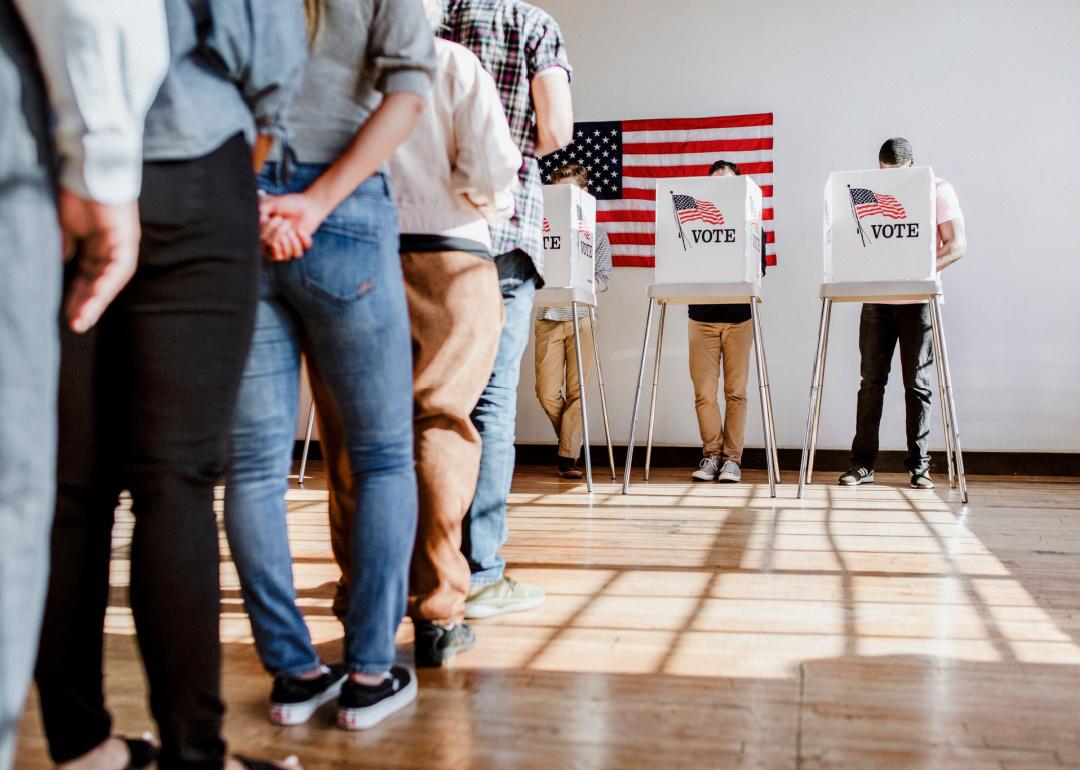
Arizona by the numbers
- Voting-eligible population: 5,137,474
- Breakdown by sex: 49.3% male, 50.7% female
- Breakdown by age: 21.8% 18-29 years old, 23.1% 30-44 years old, 30.6% 45-64 years old, 24.5% 65+ years old
- Breakdown by race: 81.1% White, 4.7% Black or African American, 2.5% Asian, 24.0% Hispanic or Latino, 4.6% Native American or Alaska Native, 0.2% Native Hawaiian or Pacific Islander, 2.9% two or more races
- Breakdown by education: 3.0% less than high school education, 7.1% some high school (no diploma), 25.2% high school graduate or equivalency, 27.4% some college (no degree), 8.7% associate's degree, 18.3% bachelor's degree, 10.3% graduate or professional degree
The highest percentage of voters in Arizona are white, between the ages of 45-64 years old, and almost equally divided by each gender. As a whole, Arizona has participated in 27 presidential elections since 1912, and in that time, the Grand Canyon State selected the winning presidential candidate 77.78% of the time.
By percentage, voters aged 45–64 are the highest in every state, with registered voters over the age of 45 comprising more than half the country's population. Older voters also trend toward turning out to vote at a higher rate and played a significant role in former President Donald Trump's 2016 victory in Florida.
Along racial lines, Black or African American voters in Louisiana and Georgia comprise more than 30% of the state's registered voters. California and Texas—which award the most electoral votes at 55 and 38, respectively—boast the highest numbers of Latino voters. On the other end of the spectrum, West Virginia and Maine boast the highest percentage of white voters. A number of states had already seen record voter turnouts, with 16 seeing more than half of its registered voters casting a ballot before Election Day.
Continue reading for a glimpse into the voter demographics of neighboring states.
Utah
- Voting-eligible population: 2,134,249
- Breakdown by sex: 49.9% male, 50.1% female
- Breakdown by age: 27.1% 18-29 years old, 28.7% 30-44 years old, 27.4% 45-64 years old, 16.8% 65+ years old
- Breakdown by race: 90.8% White, 0.9% Black or African American, 1.9% Asian, 9.6% Hispanic or Latino, 1.1% Native American or Alaska Native, 0.9% Native Hawaiian or Pacific Islander, 2.3% two or more races
- Breakdown by education: 1.5% less than high school education, 5.0% some high school (no diploma), 24.4% high school graduate or equivalency, 28.6% some college (no degree), 9.6% associate's degree, 21.1% bachelor's degree, 9.7% graduate or professional degree
The lack of Black or African American residents and voters in Utah is slowly changing, while the Hispanic or Latino group is growing much more rapidly. Though there was no clear distinction in voting preference based on age in the 2018 midterm elections, minority and educated Utah voters preferred the Democratic ticket.
California
- Voting-eligible population: 26,032,160
- Breakdown by sex: 49.1% male, 50.9% female
- Breakdown by age: 22.9% 18-29 years old, 25.0% 30-44 years old, 31.4% 45-64 years old, 20.7% 65+ years old
- Breakdown by race: 63.4% White, 6.7% Black or African American, 14.3% Asian, 30.9% Hispanic or Latino, 0.9% Native American or Alaska Native, 0.4% Native Hawaiian or Pacific Islander, 4.1% two or more races
- Breakdown by education: 4.6% less than high school education, 6.3% some high school (no diploma), 21.9% high school graduate or equivalency, 25.1% some college (no degree), 8.2% associate's degree, 21.8% bachelor's degree, 12.1% graduate or professional degree
Famous for being blue and giving its U.S.-leading 50+ electoral votes to every Democratic presidential nominee since 1992, the Golden State has 20.9 million registered voters. The percentage of registered voters increased by 10% since 2016 in California, which has one of the lowest rates of prominent white voters, while male and female balloter proportions are nearly equal, on average.


