100 countries with highest GDP per capita
100 countries with highest GDP per capita
A country's gross domestic product, or GDP, is essentially a grade on its report card. It's a quick and easy way to get a feel for how that country's economy is doing—by seeing how many billions or trillions of dollars it produced in a given year. It's not a deep dive, like a parent-teacher conference, but an overall snapshot.
Of course, GDP isn't everything. It's just one figure that doesn't take mitigating factors into account, like the amount of national debt a country entered into to produce those millions of dollars in goods or services, or the detriment to the environment that a hugely successful industry produced. Still, most experts agree that GDP is the most standardized, easily understandable way to measure the overall success or failure of economies with vastly different circumstances.
Using data from the World Bank that was last updated in 2020 with data from 2019, Stacker ranked 100 countries by their GDP per capita. GDP per capita and total GDP are defined in terms of GDP PPP (purchasing power parity), or gross domestic product that is converted to international dollars according to PPP rates. The following countries weren't included in these rankings, as the World Bank didn't have any data available on their GDP: Eritrea, Liechtenstein, North Korea, South Sudan, Syria, and Venezuela. One nation on the following list generated a whopping $19.4 trillion in 2017—while a tiny country came out with the highest GDP per capita in the world.
Keep reading to discover the 100 countries with the highest GDP per capita ahead of what will surely be significantly adjusted rates for 2020 amid the coronavirus pandemic.
#100. Dominica
- GDP per capita: $12,444 (2.4% 2009-2019 annual growth)
- GDP: $893.6 million (#179 among all countries)
In the past, this island nation's economy was extremely dependent on banana farming—though the government has also begun promoting Dominica as an ecotourism destination. Unfortunately, damage from Hurricane Maria destroyed much of Dominica's infrastructure and set the economy back significantly.
#99. Mongolia
- GDP per capita: $12,862 (6.0% 2009-2019 annual growth)
- GDP: $41.5 billion (#115 among all countries)
Mongolia’s economy has historically relied largely on livestock and agriculture, in addition to mineral extraction. The country was plunged into a depression in 1990–1991 when the Soviet Union collapsed. 2020 estimates from a January 2021 report anticipated a contracting GDP of -5.2% for Mongolia, and +4.3% for 2021, according to updated estimates from the World Bank.
#98. Iran
- GDP per capita: $12,937 (-2.4% 2009-2019 annual growth)
- GDP: $1.1 trillion (#23 among all countries)
Iran has the second highest amount of natural gas reserves and the fourth highest amount of crude oil reserves in the world, and therefore depends heavily on oil revenues. The government also has a massive presence in the country's financial and manufacturing industries.
#97. South Africa
- GDP per capita: $13,034 (1.3% 2009-2019 annual growth)
- GDP: $763.3 billion (#32 among all countries)
Unemployment, poverty, and inequality have been continual challenges for South Africa's economy, although the state does have abundant natural resources. South Africa's GDP has been increasing year over year, slowed down in 2020, and is expected to see increases of 3.1% and 2.5% in 2021 and 2022, respectively.
#96. St. Vincent and the Grenadines
- GDP per capita: $13,038 (2.3% 2009-2019 annual growth)
- GDP: $1.4 billion (#175 among all countries)
This small island country is vulnerable to seasonality and natural disasters, as two of its main industries are banana production and tourism. The new international airport has recently spurred hope for increased economic growth.
#95. Paraguay
- GDP per capita: $13,246 (3.9% 2009-2019 annual growth)
- GDP: $93.3 billion (#92 among all countries)
In Paraguay's cities, thousands of street vendors and microenterprises do a thriving business. In more rural areas, most people eke out a living through subsistence farming. However, in recent years, Paraguay's stock has been rising on the global level—for one thing, it's the fifth largest producer of soy in the world.
#94. Ukraine
- GDP per capita: $13,341 (5.5% 2009-2019 annual growth)
- GDP: $562.2 billion (#39 among all countries)
Ukraine’s emerging free-market economy has been in the throes of economic whiplash. The country enjoyed fast-paced growth between 2000 and 2008 ahead of a debilitating financial crisis in 2008–2009; a period of recovery lasted from 2010 through 2013, with another downturn in 2014 and 2015.
#93. Peru
- GDP per capita: $13,416 (4.1% 2009-2019 annual growth)
- GDP: $436.2 billion (#47 among all countries)
Peru's mountains boast valuable deposits of silver and copper, while the coast provides huge opportunities for fishing. Though the Peruvian economy grew quite steadily from 2009 to 2013, low demand for minerals and metals, and the country's dependence on imported foods have slowed that growth.
#92. Moldova
- GDP per capita: $13,627 (8.7% 2009-2019 annual growth)
- GDP: $36.2 billion (#124 among all countries)
The landlocked European country of Moldova is among the poorest in Europe, but has made significant economic strides since the early 2000s. The country’s chief industries are services, industry, and agriculture. Two of the greatest economic threats to this former member of the Soviet Union are decreasing fertility rates and high rates of out-migration.
#91. Sri Lanka
- GDP per capita: $13,657 (6.1% 2009-2019 annual growth)
- GDP: $297.8 billion (#55 among all countries)
Sri Lanka has in recent years been evolving from a rural- to urban-based economy. Substandard performance in the textile, construction, mining, and tea industries contributed to an economic contraction in 2020, the first in 19 years. The coronavirus pandemic also had a negative influence.
#90. Guyana
- GDP per capita: $13,661 (4.4% 2009-2019 annual growth)
- GDP: $10.7 billion (#151 among all countries)
Guyana is among the poorest nations in all of South America: More than 40% of the country’s residents live on less than $5.50 a day. Half of Guyana’s citizens with post-secondary education emigrate from the country, contributing to its bleak economic outlook.
#89. Armenia
- GDP per capita: $14,258 (7.0% 2009-2019 annual growth)
- GDP: $42.2 billion (#114 among all countries)
The premature lifting of COVID-19 restrictions in Armenia contributed to spikes in contraction rates and exacerbated an already-contracting economy. The Country Partnership Framework 2019-20123 is designed to rebalance Armenia's economy by increasing exports and supporting the workforce and environment.
#88. Fiji
- GDP per capita: $14,290 (6.4% 2009-2019 annual growth)
- GDP: $12.7 billion (#149 among all countries)
Fiji's economy is primarily based on two things: tourism and agriculture. Local subsistence farmers grow crops such as copra, cocoa, kava, taro, pineapples, cassava, and bananas.
#87. Albania
- GDP per capita: $14,496 (5.1% 2009-2019 annual growth)
- GDP: $41.4 billion (#116 among all countries)
A 6.4 magnitude hurricane that ripped through Albania in 2019 was the country’s deadliest since 1979. To help with recovery efforts, around $1.2 billion was contributed from various global financial institutions and countries. That hurricane, along with the detrimental effects of COVID-19, have put undue strain on Albania’s economy.
#86. Azerbaijan
- GDP per capita: $15,041 (0.5% 2009-2019 annual growth)
- GDP: $150.8 billion (#74 among all countries)
Azerbaijan's 2020 GDP contracted in 2020 amid COVID-19 and a dropoff in oil prices, but is forecast to grow through 2025. The country's economic growth in 2019 of 2.2% represented the country's best financial year in half a decade.
#85. Lebanon
- GDP per capita: $15,196 (0.8% 2009-2019 annual growth)
- GDP: $104.2 billion (#86 among all countries)
Banking and tourism are two highlights in the Lebanese economy. Though the Lebanese government has no restrictions on foreign investment, complicated bureaucracies, high taxes, and complex customs regulations make it unattractive for many investors.
#84. Brazil
- GDP per capita: $15,300 (1.4% 2009-2019 annual growth)
- GDP: $3.2 trillion (#10 among all countries)
Though Brazil has the eighth largest GDP in the world, it is still recovering from a brutal recession in 2015 to 2016. Government corruption scandals have also hampered the economy, which largely depends on manufacturing of goods like textiles, shoes, and motor vehicles; agriculture of crops like coffee, soybeans, and sugarcane; and services like hospitality and finance.
#83. Gabon
- GDP per capita: $15,612 (1.0% 2009-2019 annual growth)
- GDP: $33.9 billion (#128 among all countries)
Though Gabon has a per capita income much higher than many of its sub-Saharan neighbors, high income inequality means that much of the population still lives in poverty. Timber, oil, and manganese exports dominate the economy.
#82. Colombia
- GDP per capita: $15,635 (4.3% 2009-2019 annual growth)
- GDP: $787.0 billion (#31 among all countries)
Colombia offers several notable exports: It's the fourth largest coal producer, third largest coffee exporter, and second largest cut-flowers exporter in the world. Widespread poverty, poor infrastructure, drug trafficking, and political instability have stopped the economy from growing much, however.
#81. Georgia
- GDP per capita: $15,656 (8.4% 2009-2019 annual growth)
- GDP: $58.2 billion (#105 among all countries)
Prior to the coronavirus pandemic, Georgia was in a sustained period of economic growth. Among many stunning statistics from the first two decades of the 21st century was the contraction of poverty from 30% in 2005 to 14% in 2019.
#80. Libya
- GDP per capita: $15,846 (-5.7% 2009-2019 annual growth)
- GDP: $107.4 billion (#82 among all countries)
Libya's economy is almost completely dependent on oil and natural gas exports. Political instability, fluctuating oil prices, and security concerns have caused the country's economy to falter in recent years.
#79. Bosnia and Herzegovina
- GDP per capita: $15,883 (5.8% 2009-2019 annual growth)
- GDP: $52.4 billion (#107 among all countries)
In Bosnia and Herzegovina, the economy largely depends on exports of metals, energy, textiles, and furniture. The decentralized government hasn't been able to reform economic policy to increase the country's GDP, and the excessive bureaucracy has hindered foreign investment.
#78. St. Lucia
- GDP per capita: $16,132 (2.8% 2009-2019 annual growth)
- GDP: $2.9 billion (#168 among all countries)
Offshore banking and tourism are the two largest industries in the island nation of St. Lucia, though tourism is by far the largest source of jobs and income. Bananas, mangos, and avocados are also grown for export.
#77. Barbados
- GDP per capita: $16,331 (0.0% 2009-2019 annual growth)
- GDP: $4.7 billion (#162 among all countries)
One of the wealthiest and most developed countries in the Caribbean, Barbados has an economy focused on sugarcane exports and tourism. It also boasts one of the highest per capita incomes in the region.
#76. China
- GDP per capita: $16,830 (7.3% 2009-2019 annual growth)
- GDP: $23.5 trillion (#1 among all countries)
China plays a huge role in the global economy—and its annual GDP ranked second among all countries. China is one of the world's largest exporters and has a relatively low GDP per capita.
#75. Suriname
- GDP per capita: $17,256 (3.0% 2009-2019 annual growth)
- GDP: $10.0 billion (#153 among all countries)
Mining is also the big industry in Suriname, where oil and gold make up about 85% of the country's exports. That means the economy can be very volatile when prices of these exports change, and the government has devalued the currency and raised taxes in recent years to combat the budget deficit.
#74. North Macedonia
- GDP per capita: $17,607 (4.9% 2009-2019 annual growth)
- GDP: $36.7 billion (#123 among all countries)
Like many countries, a period of impressive economic growth in North Macedonia was stunted by COVID-19. Economic growth throughout the country shrank by 6.4% by mid-2020.
#73. Grenada
- GDP per capita: $17,793 (5.1% 2009-2019 annual growth)
- GDP: $2.0 billion (#172 among all countries)
This small country's economy is based on two big industries: tourism and agriculture. Nutmeg and mace are Grenada's most important crops.
#72. Palau
- GDP per capita: $18,357 (3.5% 2009-2019 annual growth)
- GDP: $330.6 million (#182 among all countries)
Tourism, fisheries, and subsistence agriculture are the three main pillars of Palau's economy. The expansion of air travel to this remote part of the Pacific Ocean also indicates that tourism could to Palau could grow in the future.
#71. Botswana
- GDP per capita: $18,553 (4.1% 2009-2019 annual growth)
- GDP: $42.7 billion (#113 among all countries)
About 50 years ago, Botswana was one of the poorest countries in the world, and today it's a solidly middle-income country. This change is largely thanks to the diamond exporting business, though fluctuating demand means the economy can be volatile.
#70. Serbia
- GDP per capita: $19,013 (4.2% 2009-2019 annual growth)
- GDP: $132.0 billion (#79 among all countries)
Manufacturing and exports dominate the Serbian economy, which continues to struggle with high unemployment rates and extensive public debt. Serbia has gradually increased its GDP in recent years, however.
#69. Dominican Republic
- GDP per capita: $19,228 (6.2% 2009-2019 annual growth)
- GDP: $206.5 billion (#66 among all countries)
Historically, crops such as sugar, coffee, and tobacco have dominated the Dominican Republic's economy, but today it's much more diversified. Tourism, construction, and other service industries are helping the country quickly grow its economy.
#68. Thailand
- GDP per capita: $19,277 (4.7% 2009-2019 annual growth)
- GDP: $1.3 trillion (#19 among all countries)
International exports of goods such as electronics, agricultural commodities, automobiles and parts, and processed foods constitute about two-thirds of Thailand's GDP. Tourism and government spending on infrastructure improvements have helped the country rebound economically since 2014.
#67. Equatorial Guinea
- GDP per capita: $19,379 (-6.4% 2009-2019 annual growth)
- GDP: $26.3 billion (#137 among all countries)
Since the 1990s, Equatorial Guinea has used its oil and gas deposits to spur economic growth in the country. Forestry and farming are two other major industries.
#66. Belarus
- GDP per capita: $19,997 (3.6% 2009-2019 annual growth)
- GDP: $189.3 billion (#68 among all countries)
- Since the decline of Soviet Union, Belarus has struggled to become independent from Russian energy markets. Additionally, state-owned industries make around 80% of the GDP.
#65. Maldives
- GDP per capita: $20,395 (5.3% 2009-2019 annual growth)
- GDP: $10.8 billion (#150 among all countries)
Known for its stunning natural beauty and turquoise waters, the Maldives has cemented a reputation as a gorgeous vacation destination. It's no surprise, then, that tourism is one of the main industries, along with fishing.
#64. Costa Rica
- GDP per capita: $20,443 (5.4% 2009-2019 annual growth)
- GDP: $103.2 billion (#87 among all countries)
Bananas, coffee, beef, and sugar exports help support Costa Rica's economy, along with ecotourism and the production of specialized goods like medical devices. Foreign investors are treated similarly to domestic investors under Costa Rican law.
#63. Mexico
- GDP per capita: $20,582 (3.5% 2009-2019 annual growth)
- GDP: $2.6 trillion (#12 among all countries)
Since the establishment of the North American Free Trade Agreement (NAFTA) in 1994, Mexico's economy—the 11th largest in the world—has been highly focused on manufacturing. It's also the second largest export market for the U.S. and the third largest import market.
#62. Uruguay
- GDP per capita: $22,515 (3.8% 2009-2019 annual growth)
- GDP: $77.9 billion (#96 among all countries)
An agriculture sector focused on exports, well-educated workforce, and high social spending have helped Uruguay's economy continue to grow since the early 2000s. Even the global financial crisis in 2008 didn't stop the economic growth—just slowed it down.
#61. Antigua and Barbuda
- GDP per capita: $22,880 (0.2% 2009-2019 annual growth)
- GDP: $2.2 billion (#171 among all countries)
Tourism contributes the most to the economy of this two-island country—it accounts for nearly 60% of the GDP. Agriculture comes in second, though it is limited by water supply issues and a labor shortage.
#60. Argentina
- GDP per capita: $23,040 (3.5% 2009-2019 annual growth)
- GDP: $1.0 trillion (#25 among all countries)
Though Argentina saw relatively high growth in GDP per capita in the decade leading up to 2018, that year was an exceptionally rough year on the country's economy. Crippling drought, an inflation rate of nearly 50%, huge increases to electricity and gas bills, higher U.S. interest rates, and a score of other issues have plagued the country.
#59. Montenegro
- GDP per capita: $23,189 (5.9% 2009-2019 annual growth)
- GDP: $14.4 billion (#146 among all countries)
Tourism accounts for about 20% of Montenegro's GDP—every (pre-pandemic) year, three times as many tourists as there are residents visit the country. Energy and agriculture are the two other pillars of the economy.
#58. Mauritius
- GDP per capita: $23,882 (4.8% 2009-2019 annual growth)
- GDP: $30.2 billion (#131 among all countries)
This island state with about 1.3 million citizens is now considered a high-income economy—a huge accomplishment, as it only gained independence in 1968. Tourism continues to grow, and the number of visitors in 2017 was greater than the population of Mauritius.
#57. Bulgaria
- GDP per capita: $24,790 (5.7% 2009-2019 annual growth)
- GDP: $172.9 billion (#71 among all countries)
Although Bulgaria's economy has shown strong growth since the country joined the European Union in 2007, per capita income is still the lowest of all the member states. It also remains dependent on Russia for energy imports.
#56. Chile
- GDP per capita: $25,155 (4.5% 2009-2019 annual growth)
- GDP: $476.7 billion (#43 among all countries)
Chile has built a reputation as a country with strong financial institutions and excellent economic policy. About one-third of Chile's GDP is devoted to exports of goods and services.
#55. Curacao
- GDP per capita: $25,563 (-0.5% 2009-2019 annual growth)
- GDP: $4.0 billion (#165 among all countries)
Curacao is a Lesser Antilles island country in the Caribbean Sea with an open economy. Its chief sectors include tourism, shipping, oil refining, and international trade.
#54. Trinidad and Tobago
- GDP per capita: $27,334 (-0.7% 2009-2019 annual growth)
- GDP: $38.1 billion (#120 among all countries)
Though it has one of the highest per capita incomes in Latin America, Trinidad and Tobago has seen its economic growth slow down in recent years. The energy sector represents much of the country's economic activity.
#53. Kazakhstan
- GDP per capita: $27,518 (4.4% 2009-2019 annual growth)
- GDP: $509.5 billion (#42 among all countries)
Mineral and hydrocarbon reserves are the foundation of Kazakhstan's economy, which is the largest of the former Soviet republics other than Russia. It also has a high amount of agriculture, mostly grain and livestock.
#52. St. Kitts and Nevis
- GDP per capita: $27,608 (2.2% 2009-2019 annual growth)
- GDP: $1.5 billion (#174 among all countries)
After the ‘70s, tourism replaced sugar as the primary industry on St. Kitts and Nevis. This country's economy is highly vulnerable to natural disasters and changing travel trends, as are many of its Caribbean neighbors.
#51. Turkey
- GDP per capita: $28,134 (6.1% 2009-2019 annual growth)
- GDP: $2.3 trillion (#13 among all countries)
The Turkish government's sweeping reforms in the early 2000s did dramatically reduce poverty and help the country attract more foreign trade, but the political and economic turbulence of 2018 stopped nearly all the progress.
#50. Oman
- GDP per capita: $28,507 (-4.6% 2009-2019 annual growth)
- GDP: $141.8 billion (#76 among all countries)
Oman's economy depends heavily on its oil and gas reserves, which account for up to 85% of the government's revenue. The government is also pursuing a development plan to diversify and privatize many of the country's industries.
#49. Russia
- GDP per capita: $29,181 (4.2% 2009-2019 annual growth)
- GDP: $4.3 trillion (#6 among all countries)
Although Russia is no longer a centrally planned economy as it was during the Soviet Union, much of the wealth is still concentrated in the hands of high-ranking government officials. It's one of the leading producers of oil, natural gas, steel, and primary aluminum.
#48. Malaysia
- GDP per capita: $29,620 (4.4% 2009-2019 annual growth)
- GDP: $946.3 billion (#28 among all countries)
Although Malaysia's economy was once based on commodities and agriculture, the country has since diversified to include greater manufacturing and service industries. Today, it's a leading exporter of electrical appliances, electronic parts, and other components.
#47. Croatia
- GDP per capita: $30,141 (4.2% 2009-2019 annual growth)
- GDP: $122.6 billion (#81 among all countries)
After Croatia joined the European Union in 2013, its economy has seen continued growth and the poverty rate has started to drop. Tourism has also grown in recent years—a promising industry for the up-and-coming country.
#46. Seychelles
- GDP per capita: $30,517 (5.1% 2009-2019 annual growth)
- GDP: $3.0 billion (#167 among all countries)
From the time the Seychelles received its independence in 1978 until now, the country's economy has grown to nearly seven times its previous level. Tourism—which employs about a quarter of the residents and accounts for over half of the GDP—is the biggest growth sector.
#45. Greece
- GDP per capita: $30,722 (0.1% 2009-2019 annual growth)
- GDP: $329.2 billion (#54 among all countries)
The Greek economy suffered a devastating blow during the global financial crisis, contracting by more than a quarter from 2009 to 2013. It is currently a major beneficiary of European Union aid, which accounts for 3.3% of the yearly GDP.
#44. Latvia
- GDP per capita: $32,191 (6.6% 2009-2019 annual growth)
- GDP: $61.6 billion (#101 among all countries)
Timber, wood-processing, agriculture, and machinery manufacturing are the largest industries in Latvia. The country's decreasing population and government corruption continue to impede its economic growth, however.
#43. Romania
- GDP per capita: $32,297 (6.9% 2009-2019 annual growth)
- GDP: $625.2 billion (#35 among all countries)
Strong industrial exports, top-notch agricultural harvests, and new fiscal policies helped Romania's economy make some serious gains from 2013 to 2017. Exports to the European Union accounted for much of the growth.
#42. Panama
- GDP per capita: $32,851 (8.6% 2009-2019 annual growth)
- GDP: $139.5 billion (#78 among all countries)
Service—including the operation of the Panama Canal, banking, logistics, container ports, and insurance—make up more than three-quarters of Panama's GDP. Transportation and logistics, in particular, have shown promising growth.
#41. Slovak Republic
- GDP per capita: $34,067 (4.0% 2009-2019 annual growth)
- GDP: $185.8 billion (#69 among all countries)
Since the government implemented a slew of economic reforms in 1998, Slovakia's economy has been growing slowly but surely. Automobile and electronics drive the exports business and make up about 80% of the country's GDP.
#40. Poland
- GDP per capita: $34,431 (6.0% 2009-2019 annual growth)
- GDP: $1.3 trillion (#20 among all countries)
With the sixth largest economy in the European Union, Poland has a reputation for smart economic policies and its business-friendly attitude. Many young, educated Polish people choose to leave their home country for other EU member states, however—costing the country valuable talent in the long run.
#39. Hungary
- GDP per capita: $34,507 (5.2% 2009-2019 annual growth)
- GDP: $337.1 billion (#53 among all countries)
After suffering a historic economic contraction during the 2008 recession, Hungary has been slow to rebound. The country faces systemic challenges in its economy including poverty in rural regions, labor shortages, and corruption, along with being heavily reliant on energy imports from Russia.
#38. Portugal
- GDP per capita: $36,639 (3.3% 2009-2019 annual growth)
- GDP: $376.3 billion (#50 among all countries)
Since it joined the European Community (the EU's predecessor) in 1986, Portugal has considerably diversified its economy. Though the global financial crisis did push Portugal's economy into a recession from 2011 to 2013, the economy has steadily improved since then.
#37. Lithuania
- GDP per capita: $38,502 (7.8% 2009-2019 annual growth)
- GDP: $107.3 billion (#83 among all countries)
Lithuania's economy may be fairly small, but it nearly doubled in size from 2000 to 2014. The country saw a downturn in 2020, but projections indicate slowing growth from 2021 to 2025. Refined petroleum, fertilizer, cars, cheese, and wine are some of Lithuania's most popular exports.
#36. The Bahamas
- GDP per capita: $38,743 (2.3% 2009-2019 annual growth)
- GDP: $15.1 billion (#145 among all countries)
Like many other Caribbean countries, the Bahamas is highly economically dependent on tourism and financial services. Not only does tourism account for nearly half of the country's GDP, but it also employs more than half of the Bahamian workforce.
#35. Estonia
- GDP per capita: $38,915 (6.6% 2009-2019 annual growth)
- GDP: $51.6 billion (#108 among all countries)
Although Estonia's economy has one of the higher per capita income levels in Central Europe and the Baltic region, it is incredibly vulnerable to external shocks since it depends so heavily on trade. The electronics and telecommunications sectors are the strongest, and Estonia has valuable trade ties to Finland, Sweden, Germany, and Russia.
#34. Slovenia
- GDP per capita: $40,983 (4.0% 2009-2019 annual growth)
- GDP: $85.6 billion (#93 among all countries)
Slovenia has one of the highest GDPs per capita in the region, thanks in part to its advantageous location between the Balkans and Western Europe. Top-notch infrastructure and a well-educated workforce are also massive assets.
#33. Cyprus
- GDP per capita: $41,254 (2.0% 2009-2019 annual growth)
- GDP: $36.9 billion (#122 among all countries)
Tourism, finance, shipping, and real estate are four of the most important industries to Cyprus' service-oriented economy. It struggled during the global financial crisis and received a $13 billion bailout from the European Commission, European Central Bank, and the International Monetary Fund.
#32. Israel
- GDP per capita: $42,146 (4.4% 2009-2019 annual growth)
- GDP: $381.6 billion (#49 among all countries)
Israel prides itself on its advances in technology, so it's no surprise that high-tech equipment ranks among its largest exports, along with cut diamonds and pharmaceuticals. It also imports large amounts of crude oil, grain, military equipment, and raw materials.
#31. Spain
- GDP per capita: $42,195 (2.8% 2009-2019 annual growth)
- GDP: $2.0 trillion (#15 among all countries)
The global financial crisis also sparked a prolonged recession in Spain, but the country experienced six consecutive years of economic growth through 2019, followed by a downturn in 2020. Numbers for 2021 rebounded in the first quarter of 2021. Increases in exports and labor productivity can be credited for some of Spain's success.
#30. South Korea
- GDP per capita: $43,143 (3.8% 2009-2019 annual growth)
- GDP: $2.2 trillion (#14 among all countries)
South Korea is of the 20th century's most impressive success stories. After the war with North Korea in the 1950s, it became a globally connected, high-tech society within just a few decades. Ongoing tensions with North Korea continue to be a problem.
#29. Japan
- GDP per capita: $43,236 (2.7% 2009-2019 annual growth)
- GDP: $5.5 trillion (#4 among all countries)
The Japanese economy has developed remarkably over the past 70 years. Today, Japan's GDP is driven by the country's dominance in technology, cooperation between the government and industry, and promising government reforms.
#28. Czech Republic
- GDP per capita: $43,300 (4.5% 2009-2019 annual growth)
- GDP: $462.0 billion (#45 among all countries)
The unemployment rate in the Czech Republic is among the lowest of any country in the European Union. Rapid wage growth and low public debt are also signs of an economy on the up and up.
#27. New Zealand
- GDP per capita: $43,953 (3.7% 2009-2019 annual growth)
- GDP: $216.1 billion (#65 among all countries)
Forty years ago, New Zealand had an agrarian economy that was dependent on British market access. Today, the country's industrialized free-market economy is a global player.
#26. Italy
- GDP per capita: $44,248 (2.5% 2009-2019 annual growth)
- GDP: $2.7 trillion (#11 among all countries)
Italy's economy can be split into two geographic regions: to the north, privately held industrial companies dominate, while in the south, highly subsidized agriculture reigns supreme. The manufacturing of high-quality consumer goods like olive oil and leather drives much of the economy, although underground enterprises may make up as much as 17% of the country's GDP.
#25. Malta
- GDP per capita: $46,279 (5.7% 2009-2019 annual growth)
- GDP: $23.3 billion (#140 among all countries)
The smallest economy in the eurozone nonetheless has a relatively high GDP per capita. Malta relies heavily on trade with Europe, as it produces less than a quarter of its needs for food and has limited fresh water and energy supplies.
#24. Bahrain
- GDP per capita: $47,003 (0.1% 2009-2019 annual growth)
- GDP: $77.1 billion (#97 among all countries)
Although the Bahrain government has been attempting to diversify the economy in recent years, it is still extremely dependent on sales of oil and natural gas. Slipping energy prices have taken a toll on the country in recent years.
#23. United Kingdom
- GDP per capita: $48,698 (3.3% 2009-2019 annual growth)
- GDP: $3.3 trillion (#9 among all countries)
After Germany and France, the United Kingdom is the third largest economy in Europe. Banking, insurance, and business services are three key drivers of the U.K.'s economic growth, though the referendum vote to leave the European Union cast a shadow over the economy.
#22. Saudi Arabia
- GDP per capita: $49,040 (-0.2% 2009-2019 annual growth)
- GDP: $1.7 trillion (#17 among all countries)
Like many of its neighbors in the Middle East, Saudi Arabia depends heavily on oil for its economy. The government controls much of the economic activity and Saudi Arabia is the world's leading exporter of petroleum.
#21. France
- GDP per capita: $49,435 (3.6% 2009-2019 annual growth)
- GDP: $3.3 trillion (#8 among all countries)
With 89 million foreign tourists in 2017, France is the world's most highly visited country. It isn't solely dependent on tourism: The economy is highly diversified and the government has partially or fully privatized many large companies like Air France and France Telecom.
#20. Canada
- GDP per capita: $51,342 (2.8% 2009-2019 annual growth)
- GDP: $1.9 trillion (#16 among all countries)
The growth of the manufacturing, mining, and milling sectors have turned Canada from a mostly agricultural, rural nation to one that boasts serious industrial power. Canada is also the world's seventh largest oil provider.
#19. Finland
- GDP per capita: $51,426 (3.1% 2009-2019 annual growth)
- GDP: $283.9 billion (#58 among all countries)
Exports account for up to one-third of Finland's GDP, so foreign trade is important to this Scandinavian nation. The wood, metals, telecommunications, electronics, and engineering industries are particularly high-performing.
#18. Kuwait
- GDP per capita: $52,060 (-4.1% 2009-2019 annual growth)
- GDP: $219.0 billion (#64 among all countries)
Though geographically small, Kuwait's economy is mighty thanks to its substantive crude oil reserves. Petroleum exports account for more than half of GDP and 92% of Kuwait's export revenues.
#17. Australia
- GDP per capita: $53,469 (2.9% 2009-2019 annual growth)
- GDP: $1.4 trillion (#18 among all countries)
With minimal restrictions on imports, Australia has opened its doors wide to foreign trade, which made the economy more flexible, dynamic, and productive. Food, energy, and natural resources like coal, iron, copper, and gold are some of the country's biggest exports.
#16. Belgium
- GDP per capita: $54,905 (3.8% 2009-2019 annual growth)
- GDP: $630.5 billion (#34 among all countries)
Transport, services, manufacturing, and technology are four of the largest sectors of the Belgian economy, although it is highly diversified. The country's excellent transport network and central location have propelled it to economic success.
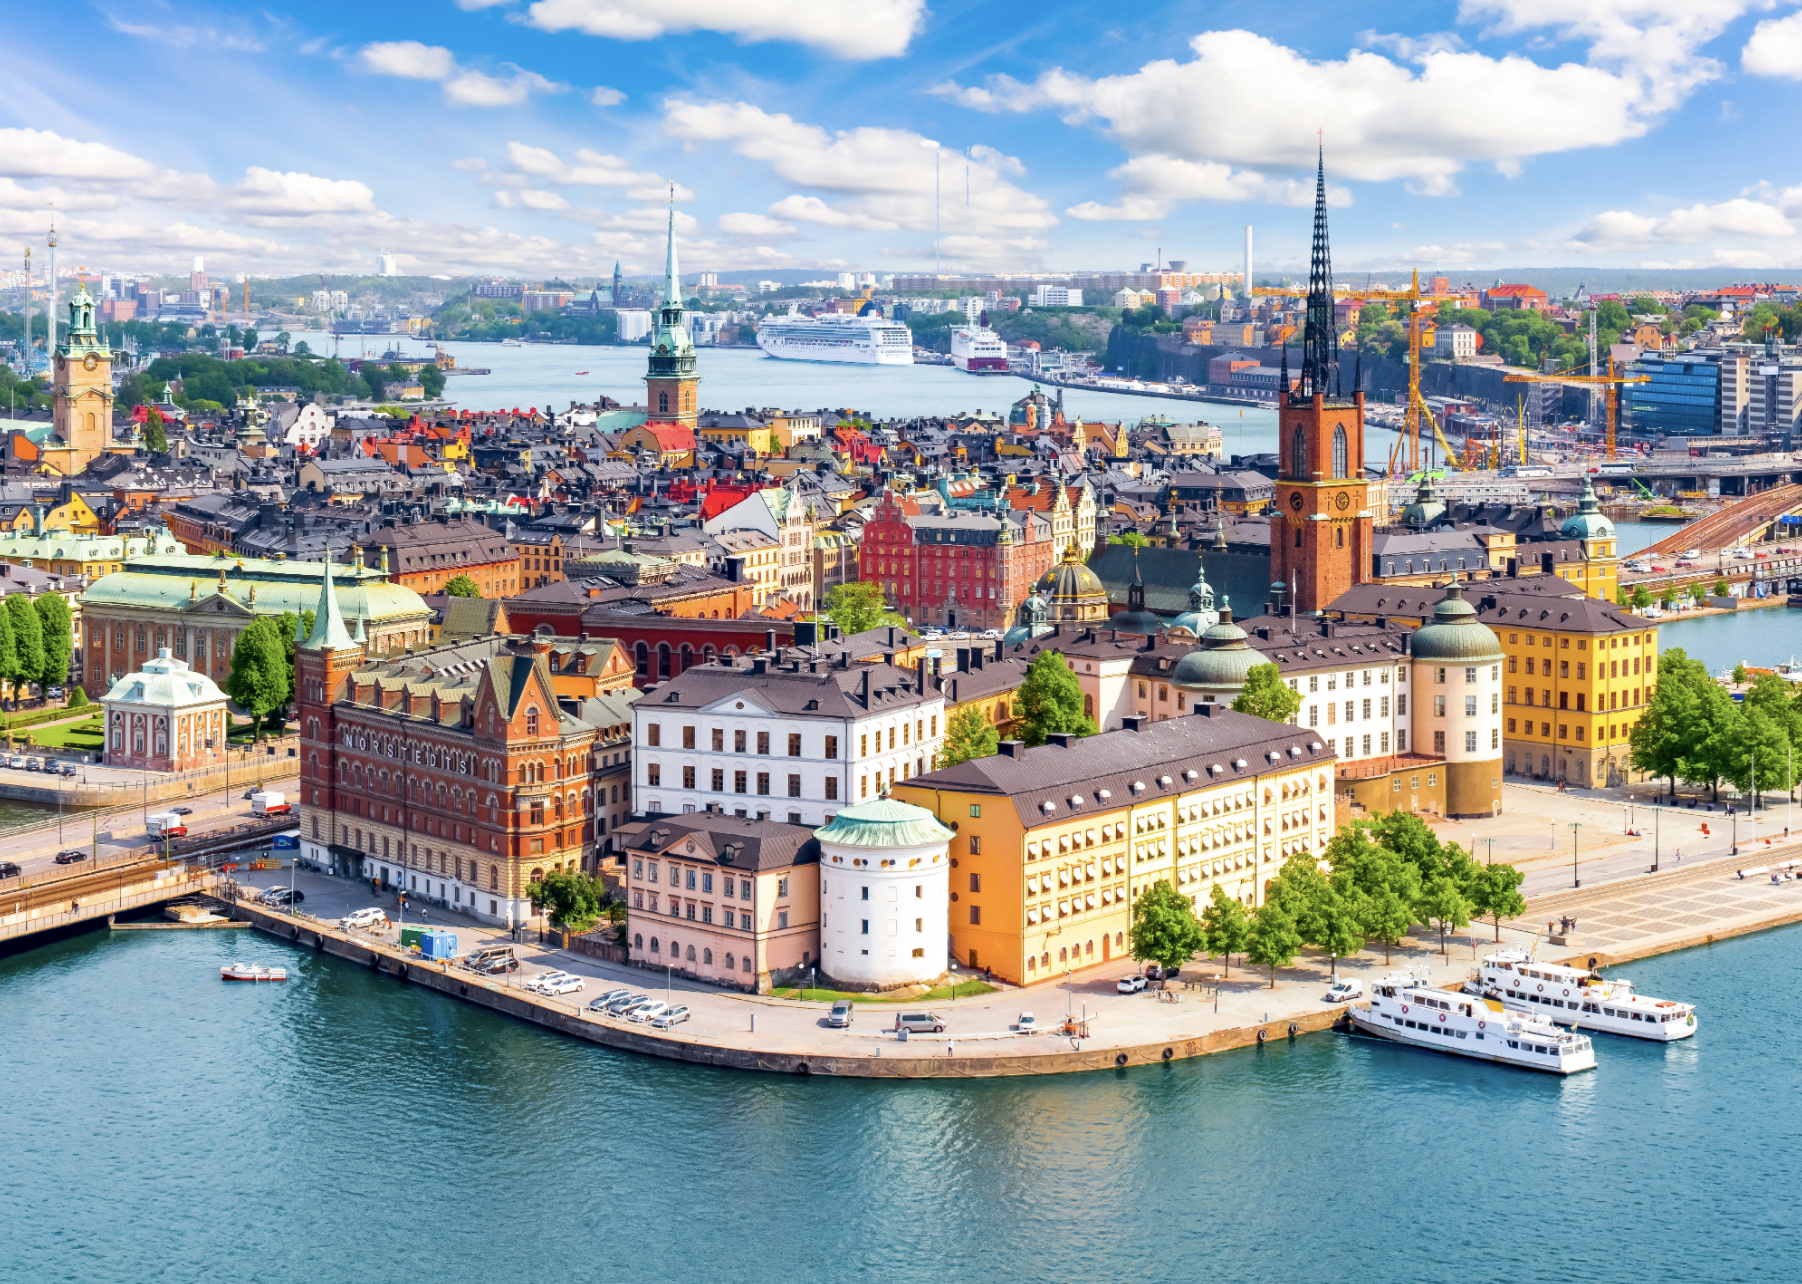
#15. Sweden
- GDP per capita: $55,820 (3.3% 2009-2019 annual growth)
- GDP: $574.1 billion (#38 among all countries)
The high standard of living in Sweden has gained acclaim worldwide, thanks in part to its thriving competitive economy. Exports like engines, motor vehicles, other machines, and telecommunications equipment made up about 44% of the GDP as of March 2021.
#14. Germany
- GDP per capita: $56,278 (4.3% 2009-2019 annual growth)
- GDP: $4.7 trillion (#5 among all countries)
Germany boasts Europe's largest economy, with exports of machinery, cars, chemicals, and household equipment leading the charge. A highly skilled workforce and shrewd government policies have helped Germany create a reputation as an economic powerhouse.
#13. Austria
- GDP per capita: $58,946 (3.7% 2009-2019 annual growth)
- GDP: $523.3 billion (#40 among all countries)
Austria has close ties to both other countries in the EU and also the U.S.—the latter of which is Austria's third largest trading partner. Exports make up about 60% of GDP.
#12. Netherlands
- GDP per capita: $59,554 (2.9% 2009-2019 annual growth)
- GDP: $1.0 trillion (#26 among all countries)
The sixth largest economy in Europe, the Netherlands has become a transportation hub. Food processing, chemicals, petroleum refining, and electrical machinery make up the bulk of the economy.
#11. Iceland
- GDP per capita: $60,061 (3.7% 2009-2019 annual growth)
- GDP: $21.7 billion (#141 among all countries)
High growth, low unemployment, and even distribution of income have come to define Iceland's economy in recent years. The industries of biotechnology, tourism, and software production have shown particular promise.
#10. Denmark
- GDP per capita: $60,178 (4.1% 2009-2019 annual growth)
- GDP: $350.2 billion (#52 among all countries)
Denmark boasts companies that lead the world in pharmaceuticals, maritime shipping, renewable energy, and a high-tech agriculture. The country offers an elevated standard of living as well as government-mandated social welfare programs.
#9. Brunei
- GDP per capita: $64,848 (-1.9% 2009-2019 annual growth)
- GDP: $28.1 billion (#135 among all countries)
The same family has ruled Brunei for more than six centuries, from its time as a regional power that controlled Borneo and parts of the Philippines, to its tenure as British protectorate in the 1800s, to its progress as an independent nation today. Extensive petroleum and natural gas fields help its economy.
#8. United States
- GDP per capita: $65,298 (3.3% 2009-2019 annual growth)
- GDP: $21.4 trillion (#2 among all countries)
Though the U.S. has the highest GDP in the world, it's only #8 on GDP per capita. Information, real estate, scientific services, professional services, and technical services are leading contributors of growth in the U.S. economy.
#7. Norway
- GDP per capita: $66,832 (1.9% 2009-2019 annual growth)
- GDP: $357.4 billion (#51 among all countries)
Though Norway opted out of joining the EU in 1994, it is a member of the European Economic Area and contributes to the EU budget. Norway is the world's second-largest producer of seafood and has a wealth of natural resources like oil, gas, forests, and minerals.
#6. United Arab Emirates
- GDP per capita: $70,089 (0.3% 2009-2019 annual growth)
- GDP: $684.8 billion (#33 among all countries)
The United Arab Emirates has focused on diversifying its economy so it's not entirely dependent on oil and gas—now, that sector accounts for 30% of the country's GDP. The United Arab Emirates is working to improve education and create more job opportunities, and it is also trying to boost tourism and global trade.
#5. Switzerland
- GDP per capita: $70,989 (3.2% 2009-2019 annual growth)
- GDP: $608.7 billion (#36 among all countries)
Switzerland's developed service sector, well-educated workforce, and high-tech manufacturing industry have helped it build the second highest GDP per capita in the world. The stable political and economic situation, and top-notch infrastructure, make Switzerland an enviable place to do business.
#4. Ireland
- GDP per capita: $88,241 (7.8% 2009-2019 annual growth)
- GDP: $436.0 billion (#48 among all countries)
Ireland was hard hit during the global financial crisis, but has recovered, experiencing GDP growth since 2010. After austerity measures and a $92 billion bailout program from the EU and IMF, Ireland has once again returned to prosperity, thanks to a thriving export program and low corporation tax rate.
#3. Qatar
- GDP per capita: $94,029 (-2.6% 2009-2019 annual growth)
- GDP: $266.3 billion (#59 among all countries)
Oil and natural gas are Qatar's two main revenue sources and have driven the country's economic growth in recent years. As it prepares to host the World Cup in 2022, Qatar is also spending heavily on construction.
#2. Singapore
- GDP per capita: $101,649 (4.4% 2009-2019 annual growth)
- GDP: $579.8 billion (#37 among all countries)
The economy of small-but-mighty Singapore is driven in part by a business-friendly regulatory environment and a rapid period of industrialization in the 1960s. Manufacturing and service are the two pillars of the Singaporean economy.
#1. Luxembourg
- GDP per capita: $121,293 (3.9% 2009-2019 annual growth)
- GDP: $75.2 billion (#99 among all countries)
Luxembourg has a small but stable economy that is known for its steady growth and low inflation. The government focused on diversifying the economy in the early 2000s, and today, the country boasts world-renowned logistics, information and communications technology, health technologies, clean energy, space technology, and financial services sectors.


