Counties in Illinois where people spend most of their paycheck on housing
Counties in Illinois where people spend most of their paycheck on housing
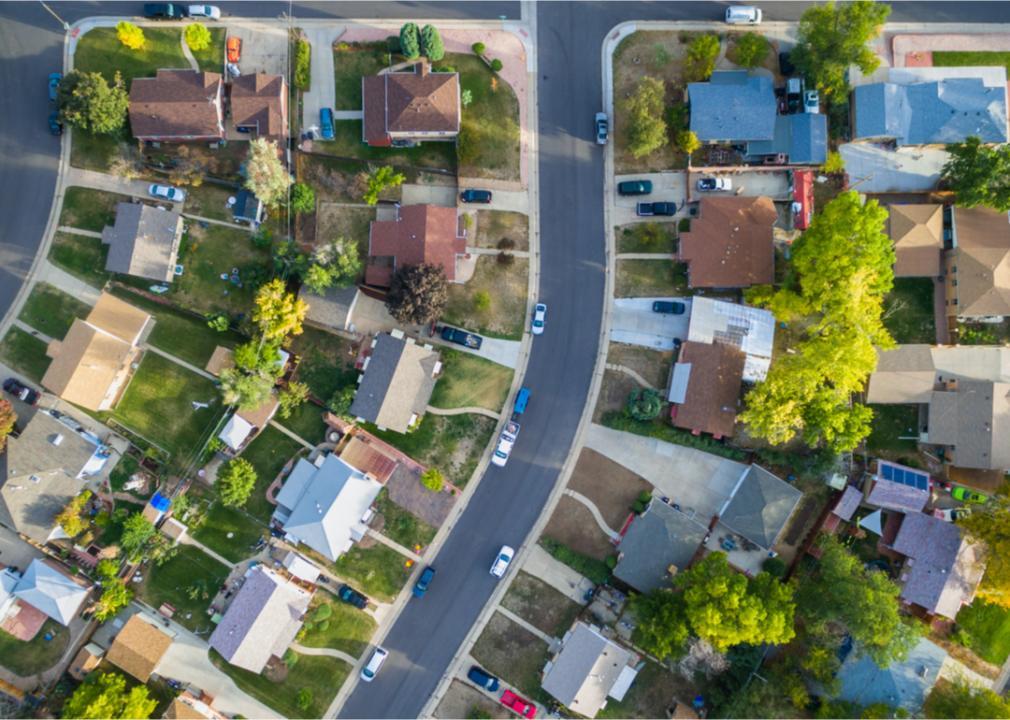
It's no secret that many Americans are forgoing homeownership in favor of renting. In 2020, renters in the U.S. occupied 43 million housing units.
The Stacker team looked at data from a United States Census survey that revealed an estimated 43,378,800 renter-occupied homes in the United States as of 2017, which makes up 36.1% of all households in the country. In 2019, renting was more affordable than buying a median-priced home in 59% of the counties; in 2021, the opposite was true: Owning was more affordable than renting in 63% of U.S. counties.
Stacker compiled a list of counties in Illinois where people spend the highest percent of income on rent using data from the U.S. Census Bureau. Of course, saving money by owning a home is unattainable for many Americans who don't have savings that could cover a down payment, those who are denied a mortgage, or both. Keep reading to see where in your home state most of people's take-home pay goes to their monthly rent.
You may also like: Best counties to raise a family in Illinois
#50. Monroe County
- Median percent of income spent on housing: 15.9%
--- Percent of households spending <20% of income on housing: 57.0%
--- Percent of households spending >30% of income on housing: 22.3%
- Total occupied households: 13,586
- Median household income: $85,747
- Median monthly housing cost: $1,135
#49. Douglas County
- Median percent of income spent on housing: 15.9%
--- Percent of households spending <20% of income on housing: 57.3%
--- Percent of households spending >30% of income on housing: 23.9%
- Total occupied households: 7,613
- Median household income: $56,714
- Median monthly housing cost: $751
#48. Bureau County
- Median percent of income spent on housing: 15.9%
--- Percent of households spending <20% of income on housing: 58.8%
--- Percent of households spending >30% of income on housing: 20.5%
- Total occupied households: 13,698
- Median household income: $57,436
- Median monthly housing cost: $761
#47. Saline County
- Median percent of income spent on housing: 15.9%
--- Percent of households spending <20% of income on housing: 58.5%
--- Percent of households spending >30% of income on housing: 21.1%
- Total occupied households: 9,972
- Median household income: $44,090
- Median monthly housing cost: $585
#46. Pulaski County
- Median percent of income spent on housing: 16.0%
--- Percent of households spending <20% of income on housing: 54.8%
--- Percent of households spending >30% of income on housing: 21.0%
- Total occupied households: 2,095
- Median household income: $34,640
- Median monthly housing cost: $462
You may also like: Counties with the oldest homes in Illinois
#45. Fulton County
- Median percent of income spent on housing: 16.1%
--- Percent of households spending <20% of income on housing: 58.2%
--- Percent of households spending >30% of income on housing: 19.9%
- Total occupied households: 13,940
- Median household income: $51,643
- Median monthly housing cost: $691
#44. Mason County
- Median percent of income spent on housing: 16.1%
--- Percent of households spending <20% of income on housing: 59.2%
--- Percent of households spending >30% of income on housing: 19.2%
- Total occupied households: 5,977
- Median household income: $48,417
- Median monthly housing cost: $648
#43. Lee County
- Median percent of income spent on housing: 16.1%
--- Percent of households spending <20% of income on housing: 56.6%
--- Percent of households spending >30% of income on housing: 21.8%
- Total occupied households: 13,788
- Median household income: $58,194
- Median monthly housing cost: $781
#42. Jo Daviess County
- Median percent of income spent on housing: 16.3%
--- Percent of households spending <20% of income on housing: 54.2%
--- Percent of households spending >30% of income on housing: 22.4%
- Total occupied households: 9,970
- Median household income: $57,946
- Median monthly housing cost: $788
#41. Pike County
- Median percent of income spent on housing: 16.4%
--- Percent of households spending <20% of income on housing: 56.2%
--- Percent of households spending >30% of income on housing: 20.7%
- Total occupied households: 6,309
- Median household income: $47,492
- Median monthly housing cost: $648
You may also like: Most popular girl names in the 70s in Illinois
#40. Tazewell County
- Median percent of income spent on housing: 16.5%
--- Percent of households spending <20% of income on housing: 56.3%
--- Percent of households spending >30% of income on housing: 19.6%
- Total occupied households: 54,291
- Median household income: $63,454
- Median monthly housing cost: $870
#39. Marion County
- Median percent of income spent on housing: 16.5%
--- Percent of households spending <20% of income on housing: 56.6%
--- Percent of households spending >30% of income on housing: 22.3%
- Total occupied households: 15,946
- Median household income: $47,519
- Median monthly housing cost: $652
#38. Alexander County
- Median percent of income spent on housing: 16.6%
--- Percent of households spending <20% of income on housing: 53.1%
--- Percent of households spending >30% of income on housing: 25.9%
- Total occupied households: 2,154
- Median household income: $36,806
- Median monthly housing cost: $508
#37. Whiteside County
- Median percent of income spent on housing: 16.6%
--- Percent of households spending <20% of income on housing: 58.3%
--- Percent of households spending >30% of income on housing: 20.5%
- Total occupied households: 23,084
- Median household income: $54,232
- Median monthly housing cost: $752
#36. Iroquois County
- Median percent of income spent on housing: 16.8%
--- Percent of households spending <20% of income on housing: 55.4%
--- Percent of households spending >30% of income on housing: 23.7%
- Total occupied households: 11,741
- Median household income: $52,700
- Median monthly housing cost: $738
You may also like: Most popular boy names in the 60s in Illinois
#35. Franklin County
- Median percent of income spent on housing: 16.9%
--- Percent of households spending <20% of income on housing: 53.7%
--- Percent of households spending >30% of income on housing: 22.7%
- Total occupied households: 16,235
- Median household income: $42,769
- Median monthly housing cost: $601
#34. Vermilion County
- Median percent of income spent on housing: 16.9%
--- Percent of households spending <20% of income on housing: 57.0%
--- Percent of households spending >30% of income on housing: 21.4%
- Total occupied households: 31,151
- Median household income: $46,515
- Median monthly housing cost: $655
#33. Jefferson County
- Median percent of income spent on housing: 16.9%
--- Percent of households spending <20% of income on housing: 55.6%
--- Percent of households spending >30% of income on housing: 23.8%
- Total occupied households: 14,985
- Median household income: $49,896
- Median monthly housing cost: $704
#32. Ogle County
- Median percent of income spent on housing: 17.0%
--- Percent of households spending <20% of income on housing: 55.3%
--- Percent of households spending >30% of income on housing: 22.0%
- Total occupied households: 21,021
- Median household income: $60,986
- Median monthly housing cost: $863
#31. Macon County
- Median percent of income spent on housing: 17.1%
--- Percent of households spending <20% of income on housing: 53.7%
--- Percent of households spending >30% of income on housing: 24.3%
- Total occupied households: 43,912
- Median household income: $50,480
- Median monthly housing cost: $719
You may also like: States sending the most people to Illinois
#30. Adams County
- Median percent of income spent on housing: 17.1%
--- Percent of households spending <20% of income on housing: 55.8%
--- Percent of households spending >30% of income on housing: 21.1%
- Total occupied households: 27,112
- Median household income: $52,993
- Median monthly housing cost: $757
#29. Livingston County
- Median percent of income spent on housing: 17.2%
--- Percent of households spending <20% of income on housing: 53.3%
--- Percent of households spending >30% of income on housing: 25.0%
- Total occupied households: 14,307
- Median household income: $55,160
- Median monthly housing cost: $789
#28. LaSalle County
- Median percent of income spent on housing: 17.2%
--- Percent of households spending <20% of income on housing: 52.8%
--- Percent of households spending >30% of income on housing: 24.1%
- Total occupied households: 45,095
- Median household income: $58,142
- Median monthly housing cost: $832
#27. Sangamon County
- Median percent of income spent on housing: 17.2%
--- Percent of households spending <20% of income on housing: 53.8%
--- Percent of households spending >30% of income on housing: 24.4%
- Total occupied households: 83,711
- Median household income: $61,912
- Median monthly housing cost: $887
#26. Williamson County
- Median percent of income spent on housing: 17.3%
--- Percent of households spending <20% of income on housing: 55.4%
--- Percent of households spending >30% of income on housing: 22.4%
- Total occupied households: 27,029
- Median household income: $50,734
- Median monthly housing cost: $733
You may also like: Most popular boy names in the 70s in Illinois
#25. Morgan County
- Median percent of income spent on housing: 17.4%
--- Percent of households spending <20% of income on housing: 52.1%
--- Percent of households spending >30% of income on housing: 25.4%
- Total occupied households: 13,719
- Median household income: $51,437
- Median monthly housing cost: $744
#24. Grundy County
- Median percent of income spent on housing: 17.6%
--- Percent of households spending <20% of income on housing: 52.1%
--- Percent of households spending >30% of income on housing: 21.8%
- Total occupied households: 19,676
- Median household income: $77,350
- Median monthly housing cost: $1,132
#23. McLean County
- Median percent of income spent on housing: 17.6%
--- Percent of households spending <20% of income on housing: 51.4%
--- Percent of households spending >30% of income on housing: 22.8%
- Total occupied households: 65,845
- Median household income: $67,675
- Median monthly housing cost: $992
#22. Stephenson County
- Median percent of income spent on housing: 17.6%
--- Percent of households spending <20% of income on housing: 52.5%
--- Percent of households spending >30% of income on housing: 24.9%
- Total occupied households: 19,739
- Median household income: $48,805
- Median monthly housing cost: $716
#21. Massac County
- Median percent of income spent on housing: 17.6%
--- Percent of households spending <20% of income on housing: 53.5%
--- Percent of households spending >30% of income on housing: 26.1%
- Total occupied households: 5,822
- Median household income: $47,481
- Median monthly housing cost: $697
You may also like: Fastest-growing counties in Illinois
#20. Madison County
- Median percent of income spent on housing: 17.8%
--- Percent of households spending <20% of income on housing: 53.2%
--- Percent of households spending >30% of income on housing: 25.3%
- Total occupied households: 107,659
- Median household income: $60,738
- Median monthly housing cost: $902
#19. Rock Island County
- Median percent of income spent on housing: 17.8%
--- Percent of households spending <20% of income on housing: 53.5%
--- Percent of households spending >30% of income on housing: 23.5%
- Total occupied households: 60,546
- Median household income: $54,858
- Median monthly housing cost: $815
#18. Knox County
- Median percent of income spent on housing: 17.9%
--- Percent of households spending <20% of income on housing: 52.2%
--- Percent of households spending >30% of income on housing: 24.7%
- Total occupied households: 20,680
- Median household income: $44,129
- Median monthly housing cost: $659
#17. McDonough County
- Median percent of income spent on housing: 18.3%
--- Percent of households spending <20% of income on housing: 52.8%
--- Percent of households spending >30% of income on housing: 25.5%
- Total occupied households: 11,408
- Median household income: $44,471
- Median monthly housing cost: $678
#16. Peoria County
- Median percent of income spent on housing: 18.4%
--- Percent of households spending <20% of income on housing: 51.1%
--- Percent of households spending >30% of income on housing: 25.9%
- Total occupied households: 73,253
- Median household income: $55,842
- Median monthly housing cost: $855
You may also like: Counties with the most super commuters in Illinois
#15. Coles County
- Median percent of income spent on housing: 18.7%
--- Percent of households spending <20% of income on housing: 50.5%
--- Percent of households spending >30% of income on housing: 26.7%
- Total occupied households: 20,926
- Median household income: $46,202
- Median monthly housing cost: $721
#14. Boone County
- Median percent of income spent on housing: 19.3%
--- Percent of households spending <20% of income on housing: 48.4%
--- Percent of households spending >30% of income on housing: 27.6%
- Total occupied households: 18,571
- Median household income: $69,272
- Median monthly housing cost: $1,113
#13. Winnebago County
- Median percent of income spent on housing: 19.3%
--- Percent of households spending <20% of income on housing: 47.8%
--- Percent of households spending >30% of income on housing: 27.4%
- Total occupied households: 114,779
- Median household income: $54,489
- Median monthly housing cost: $878
#12. DuPage County
- Median percent of income spent on housing: 19.9%
--- Percent of households spending <20% of income on housing: 45.6%
--- Percent of households spending >30% of income on housing: 29.2%
- Total occupied households: 342,791
- Median household income: $92,809
- Median monthly housing cost: $1,539
#11. Kankakee County
- Median percent of income spent on housing: 19.9%
--- Percent of households spending <20% of income on housing: 48.0%
--- Percent of households spending >30% of income on housing: 29.3%
- Total occupied households: 39,796
- Median household income: $58,902
- Median monthly housing cost: $977
You may also like: Best places to retire in Illinois
#10. St. Clair County
- Median percent of income spent on housing: 20.0%
--- Percent of households spending <20% of income on housing: 47.1%
--- Percent of households spending >30% of income on housing: 28.7%
- Total occupied households: 104,105
- Median household income: $55,179
- Median monthly housing cost: $919
#9. McHenry County
- Median percent of income spent on housing: 20.2%
--- Percent of households spending <20% of income on housing: 44.9%
--- Percent of households spending >30% of income on housing: 28.3%
- Total occupied households: 112,453
- Median household income: $86,799
- Median monthly housing cost: $1,462
#8. Lake County
- Median percent of income spent on housing: 20.4%
--- Percent of households spending <20% of income on housing: 44.4%
--- Percent of households spending >30% of income on housing: 30.3%
- Total occupied households: 246,122
- Median household income: $89,427
- Median monthly housing cost: $1,520
#7. DeKalb County
- Median percent of income spent on housing: 20.4%
--- Percent of households spending <20% of income on housing: 42.9%
--- Percent of households spending >30% of income on housing: 31.6%
- Total occupied households: 38,150
- Median household income: $63,317
- Median monthly housing cost: $1,078
#6. Will County
- Median percent of income spent on housing: 20.5%
--- Percent of households spending <20% of income on housing: 44.2%
--- Percent of households spending >30% of income on housing: 28.3%
- Total occupied households: 229,498
- Median household income: $86,961
- Median monthly housing cost: $1,488
You may also like: Most popular boy names in the 80s in Illinois
#5. Kane County
- Median percent of income spent on housing: 21.0%
--- Percent of households spending <20% of income on housing: 42.4%
--- Percent of households spending >30% of income on housing: 30.2%
- Total occupied households: 179,637
- Median household income: $79,394
- Median monthly housing cost: $1,388
#4. Kendall County
- Median percent of income spent on housing: 21.3%
--- Percent of households spending <20% of income on housing: 44.2%
--- Percent of households spending >30% of income on housing: 27.3%
- Total occupied households: 40,721
- Median household income: $96,563
- Median monthly housing cost: $1,716
#3. Champaign County
- Median percent of income spent on housing: 21.5%
--- Percent of households spending <20% of income on housing: 43.3%
--- Percent of households spending >30% of income on housing: 31.0%
- Total occupied households: 82,369
- Median household income: $52,797
- Median monthly housing cost: $946
#2. Jackson County
- Median percent of income spent on housing: 22.9%
--- Percent of households spending <20% of income on housing: 42.5%
--- Percent of households spending >30% of income on housing: 35.0%
- Total occupied households: 23,883
- Median household income: $37,241
- Median monthly housing cost: $710
#1. Cook County
- Median percent of income spent on housing: 23.6%
--- Percent of households spending <20% of income on housing: 37.9%
--- Percent of households spending >30% of income on housing: 36.5%
- Total occupied households: 1,972,108
- Median household income: $64,660
- Median monthly housing cost: $1,273
You may also like: Best counties to raise a family in Illinois


