Counties with the most tornadoes in Iowa

Written by:
August 31, 2023
Canva

Counties with the most tornadoes in Iowa

It's been a busy year for tornadoes in the U.S. According to the National Oceanic and Atmospheric Administration, as many as 1,155 twisters have touched down across the country since the start of the year, above the average for this time of year.

A single day can drive up tornado counts. March 31, 2023, accounted for 163 tornadoes across the Midwest and South. Tornado activity usually peaks in the spring and early summer, and the pace of tornadoes usually slows around late summer. A smaller-scale second tornado season emerges in the fall, mostly in the Gulf Coast states.

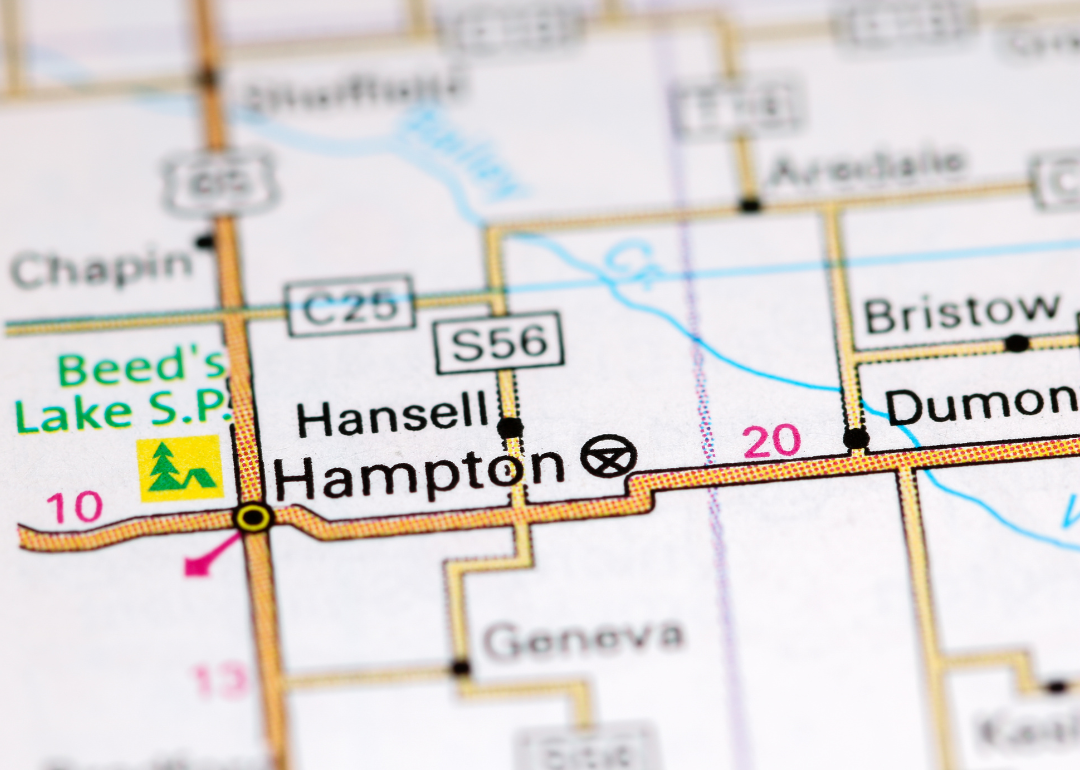
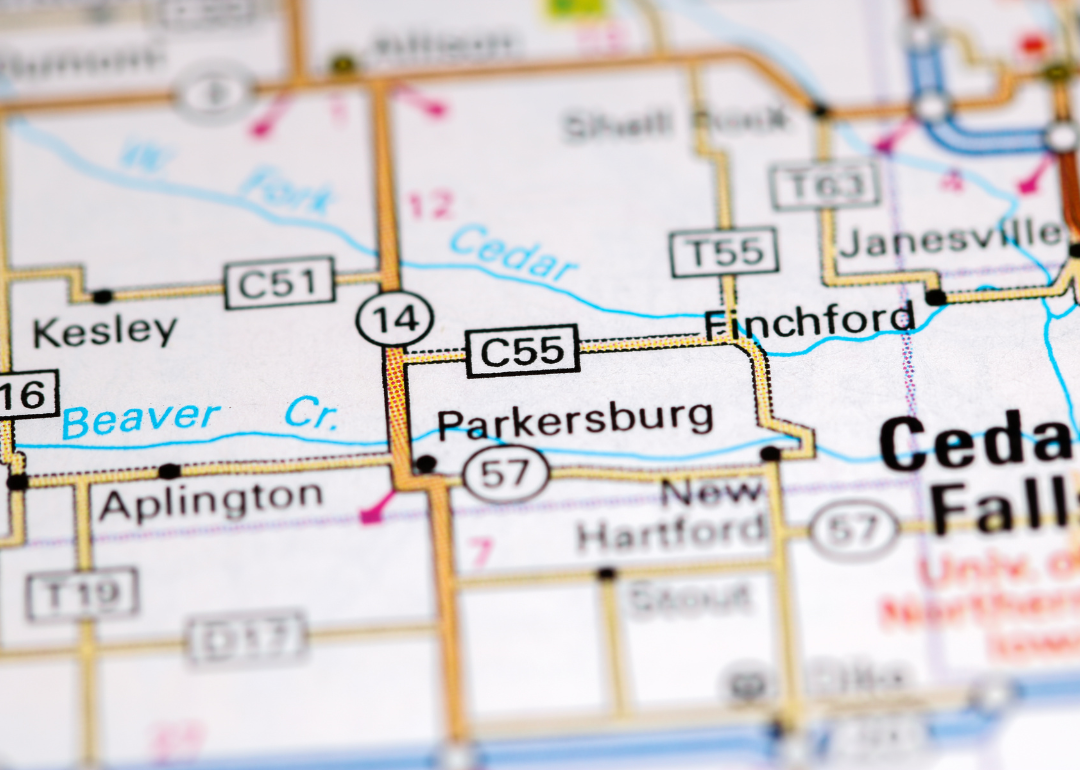
Stacker used data from NOAA's National Centers for Environmental Information to find the counties in Iowa that have experienced the most tornadoes since 2000. While data is available going back to 1950, tornado tracking by the National Weather Service became more robust and accurate in the 1990s. Since counties can vary in size, they are ranked by the number of tornadoes per 100 square miles. Counties that experienced less than five tornadoes are not included.

The counties that encounter the most tornadoes aren't all in the infamous Tornado Alley. When adjusted for county area, the top 10 counties that experienced the most tornadoes since 2000 are from nine different states, all in the Southeast with the exception of Cleveland County, Oklahoma.

Research has shown that Tornado Alley is shifting due to warming temperatures fueled by climate change. In the future, the Southeast could become the region that receives the bulk of the country's tornadoes. It's a concerning trend as the South is more populated than the Great Plains and has a higher concentration of mobile homes than other parts of the country, making the storms potentially deadlier and costlier.

As of August 2023, 75 people have died from tornadoes this year, and over 60% of those deaths occurred in mobile homes.

The best way to stay protected during tornadoes is to have multiple ways of receiving storm updates including social media, radio, television, and sirens, and to immediately seek shelter in a basement or interior room without windows when a tornado watch escalates to a warning.

Read on to see which counties experience the most tornadoes in Iowa.

1 / 50
Canva

#50. Mahaska County

- Tornadoes since 2000: 15 (2.63 per 100 square miles)
- #663 nationally
- Tornadoes this year, as of May 31: 0
2 / 50
Rexjaymes // Shutterstock

#49. Van Buren County

- Tornadoes since 2000: 13 (2.68 per 100 square miles)
- #639 nationally
- Tornadoes this year, as of May 31: 0
3 / 50
Canva

#48. Lee County

- Tornadoes since 2000: 14 (2.71 per 100 square miles)
- #631 nationally
- Tornadoes this year, as of May 31: 0
4 / 50
Canva

#47. Poweshiek County

- Tornadoes since 2000: 16 (2.74 per 100 square miles)
- #620 nationally
- Tornadoes this year, as of May 31: 1
5 / 50
SevenMaps // Shutterstock

#46. Franklin County

- Tornadoes since 2000: 16 (2.75 per 100 square miles)
- #612 nationally
- Tornadoes this year, as of May 31: 0
6 / 50
Canva

#45. Woodbury County

- Tornadoes since 2000: 24 (2.75 per 100 square miles)
- #611 nationally
- Tornadoes this year, as of May 31: 0
7 / 50
Lucas Oglesbee // Shutterstock

#44. Tama County

- Tornadoes since 2000: 20 (2.77 per 100 square miles)
- #600 nationally
- Tornadoes this year, as of May 31: 0
8 / 50
Naw Eh Wah // Shutterstock

#43. Buena Vista County

- Tornadoes since 2000: 16 (2.78 per 100 square miles)
- #595 nationally
- Tornadoes this year, as of May 31: 3
9 / 50
Canva

#42. Adair County

- Tornadoes since 2000: 16 (2.81 per 100 square miles)
- #584 nationally
- Tornadoes this year, as of May 31: 0
10 / 50
Canva

#41. Lyon County

- Tornadoes since 2000: 17 (2.89 per 100 square miles)
- #549 nationally
- Tornadoes this year, as of May 31: 0
11 / 50
Canva

#40. Wright County

- Tornadoes since 2000: 17 (2.93 per 100 square miles)
- #536 nationally
- Tornadoes this year, as of May 31: 0
12 / 50
Canva

#39. Muscatine County

- Tornadoes since 2000: 13 (2.97 per 100 square miles)
- #510 nationally
- Tornadoes this year, as of May 31: 1
13 / 50
Canva

#38. Mills County

- Tornadoes since 2000: 13 (2.97 per 100 square miles)
- #509 nationally
- Tornadoes this year, as of May 31: 0
14 / 50
Robert O Hull // Shutterstock

#37. Calhoun County

- Tornadoes since 2000: 17 (2.98 per 100 square miles)
- #501 nationally
- Tornadoes this year, as of May 31: 2
15 / 50
Jacob Boomsma // Shutterstock

#36. Carroll County

- Tornadoes since 2000: 17 (2.99 per 100 square miles)
- #500 nationally
- Tornadoes this year, as of May 31: 0
16 / 50
Canva

#35. Humboldt County

- Tornadoes since 2000: 13 (2.99 per 100 square miles)
- #497 nationally
- Tornadoes this year, as of May 31: 0
17 / 50
SevenMaps // Shutterstock

#34. Adams County

- Tornadoes since 2000: 13 (3.07 per 100 square miles)
- #473 nationally
- Tornadoes this year, as of May 31: 0
18 / 50
Designs2Rise // Shutterstock

#33. Delaware County

- Tornadoes since 2000: 18 (3.12 per 100 square miles)
- #458 nationally
- Tornadoes this year, as of May 31: 2
19 / 50
Canva

#32. Sioux County

- Tornadoes since 2000: 24 (3.12 per 100 square miles)
- #452 nationally
- Tornadoes this year, as of May 31: 0
20 / 50
Canva

#31. Jasper County

- Tornadoes since 2000: 23 (3.15 per 100 square miles)
- #441 nationally
- Tornadoes this year, as of May 31: 0
21 / 50
Canva

#30. Cerro Gordo County

- Tornadoes since 2000: 18 (3.17 per 100 square miles)
- #433 nationally
- Tornadoes this year, as of May 31: 0
22 / 50
SevenMaps // Shutterstock

#29. Butler County

- Tornadoes since 2000: 19 (3.28 per 100 square miles)
- #390 nationally
- Tornadoes this year, as of May 31: 0
23 / 50
Eddie J. Rodriquez // Shutterstock

#28. Clinton County

- Tornadoes since 2000: 23 (3.31 per 100 square miles)
- #378 nationally
- Tornadoes this year, as of May 31: 2
24 / 50
Joel McCartan // Shutterstock

#27. O'Brien County

- Tornadoes since 2000: 19 (3.32 per 100 square miles)
- #375 nationally
- Tornadoes this year, as of May 31: 0
25 / 50
Canva

#26. Marshall County

- Tornadoes since 2000: 19 (3.32 per 100 square miles)
- #374 nationally
- Tornadoes this year, as of May 31: 0
26 / 50
Daniel Novak // Shutterstock

#25. Guthrie County

- Tornadoes since 2000: 20 (3.39 per 100 square miles)
- #353 nationally
- Tornadoes this year, as of May 31: 0
27 / 50
Canva

#24. Johnson County

- Tornadoes since 2000: 21 (3.42 per 100 square miles)
- #346 nationally
- Tornadoes this year, as of May 31: 5
28 / 50
Canva

#23. Black Hawk County

- Tornadoes since 2000: 20 (3.54 per 100 square miles)
- #316 nationally
- Tornadoes this year, as of May 31: 0
29 / 50
Canva

#22. Madison County

- Tornadoes since 2000: 20 (3.56 per 100 square miles)
- #309 nationally
- Tornadoes this year, as of May 31: 0
30 / 50
dustin77a // Shutterstock

#21. Greene County

- Tornadoes since 2000: 21 (3.69 per 100 square miles)
- #286 nationally
- Tornadoes this year, as of May 31: 1
31 / 50
Gabe Shakour // Shutterstock

#20. Osceola County

- Tornadoes since 2000: 15 (3.76 per 100 square miles)
- #273 nationally
- Tornadoes this year, as of May 31: 0
32 / 50
Kelsey Haugen // Shutterstock

#19. Union County

- Tornadoes since 2000: 16 (3.78 per 100 square miles)
- #269 nationally
- Tornadoes this year, as of May 31: 0
33 / 50
Canva

#18. Pocahontas County

- Tornadoes since 2000: 22 (3.81 per 100 square miles)
- #264 nationally
- Tornadoes this year, as of May 31: 5
34 / 50
Canva

#17. Warren County

- Tornadoes since 2000: 22 (3.86 per 100 square miles)
- #255 nationally
- Tornadoes this year, as of May 31: 2
35 / 50
SevenMaps // Shutterstock

#16. Clay County

- Tornadoes since 2000: 22 (3.88 per 100 square miles)
- #253 nationally
- Tornadoes this year, as of May 31: 0
36 / 50
Canva

#15. Linn County

- Tornadoes since 2000: 28 (3.91 per 100 square miles)
- #246 nationally
- Tornadoes this year, as of May 31: 2
37 / 50
Marsen // Shutterstock

#14. Jones County

- Tornadoes since 2000: 23 (4.00 per 100 square miles)
- #233 nationally
- Tornadoes this year, as of May 31: 1
38 / 50
Canva

#13. Polk County

- Tornadoes since 2000: 24 (4.18 per 100 square miles)
- #202 nationally
- Tornadoes this year, as of May 31: 0
39 / 50
SevenMaps // Shutterstock

#12. Benton County

- Tornadoes since 2000: 30 (4.19 per 100 square miles)
- #201 nationally
- Tornadoes this year, as of May 31: 3
40 / 50
Canva

#11. Story County

- Tornadoes since 2000: 25 (4.36 per 100 square miles)
- #175 nationally
- Tornadoes this year, as of May 31: 0
41 / 50
Jacob Boomsma // Shutterstock

#10. Dallas County

- Tornadoes since 2000: 26 (4.42 per 100 square miles)
- #168 nationally
- Tornadoes this year, as of May 31: 0
42 / 50
SevenMaps // Shutterstock

#9. Howard County

- Tornadoes since 2000: 21 (4.44 per 100 square miles)
- #166 nationally
- Tornadoes this year, as of May 31: 0
43 / 50
Canva

#8. Boone County

- Tornadoes since 2000: 26 (4.55 per 100 square miles)
- #150 nationally
- Tornadoes this year, as of May 31: 0
44 / 50
Melissa L Oltman // Shutterstock

#7. Grundy County

- Tornadoes since 2000: 23 (4.58 per 100 square miles)
- #142 nationally
- Tornadoes this year, as of May 31: 2
45 / 50
Canva

#6. Scott County

- Tornadoes since 2000: 21 (4.58 per 100 square miles)
- #140 nationally
- Tornadoes this year, as of May 31: 1
46 / 50
SevenMaps // Shutterstock

#5. Hardin County

- Tornadoes since 2000: 30 (5.27 per 100 square miles)
- #89 nationally
- Tornadoes this year, as of May 31: 0
47 / 50
Canva

#4. Marion County

- Tornadoes since 2000: 30 (5.41 per 100 square miles)
- #79 nationally
- Tornadoes this year, as of May 31: 7
48 / 50
Canva

#3. Hamilton County

- Tornadoes since 2000: 32 (5.55 per 100 square miles)
- #77 nationally
- Tornadoes this year, as of May 31: 0
49 / 50
Doug Lambert // Shutterstock

#2. Buchanan County

- Tornadoes since 2000: 32 (5.60 per 100 square miles)
- #70 nationally
- Tornadoes this year, as of May 31: 2
50 / 50
Canva

#1. Webster County

- Tornadoes since 2000: 41 (5.73 per 100 square miles)
- #64 nationally
- Tornadoes this year, as of May 31: 0

Trending Now