
Best and worst states to drive in
As office culture makes a comeback, Americans are spending more time commuting by car. However, the experience of driving can be vastly different from state to state. Factors like traffic, transportation costs, safety, road infrastructure and weather differ significantly depending on your location and affect how pleasant (or unpleasant) it is to drive there.
MoneyGeek analyzed data from the Federal Highway Administration, National Highway Traffic Safety Administration, U.S. Census Bureau, FBI and more to rank the states with the best and worst driving experiences based on the five factors mentioned above.
Key findings
- New Jersey is the worst state to drive in, boasting the highest road congestion nationwide and the second-worst road quality.
- California, which is the second-worst state in the ranking, is also the priciest state for drivers. The Golden State has gas prices nearing $5 per gallon, yearly maintenance costs averaging $416 and annual toll expenses amounting to $499.
- Nebraska is the most driver-friendly state, with the lowest vehicle-related costs nationwide. The Cornhusker State ranks sixth-best for its infrastructure quality, with over 90% of its roads and bridges in acceptable condition.
- The nation's least congested roads are found in North Dakota. The average morning commute time there is only 19 minutes, eight minutes shorter than the national average of 27 minutes.
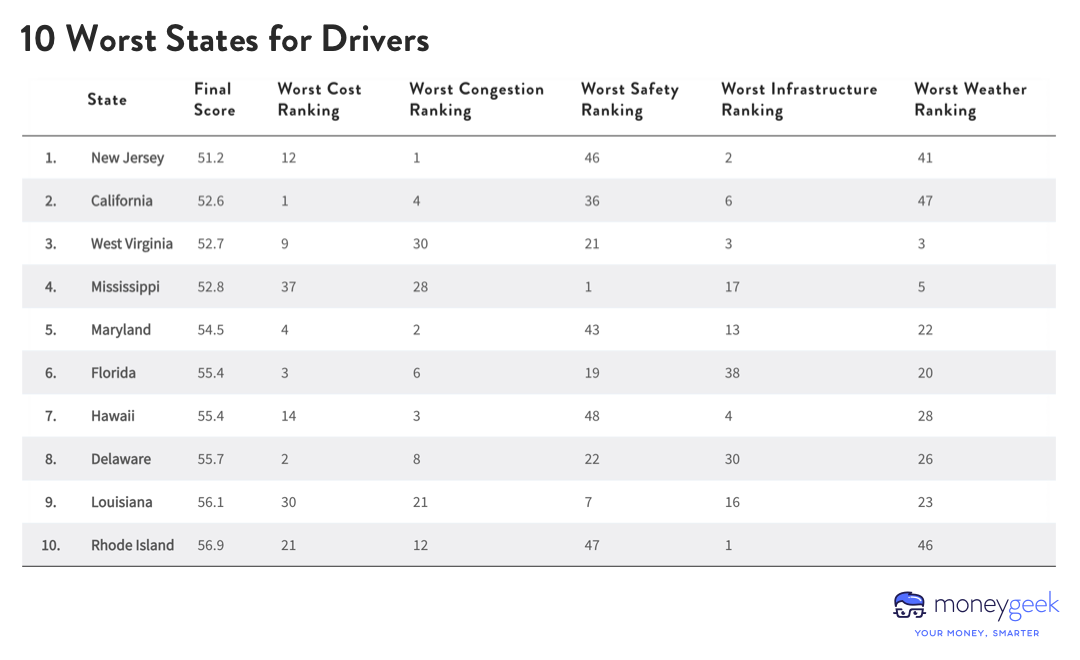
10 worst states to drive in
Driving has its perks, but it also comes with challenges — this is especially true in New Jersey, which takes the top spot as the most challenging state to drive in the U.S. The Garden State experiences the highest level of road congestion in the country, with average morning commute times reaching up to 31 minutes. To make matters worse, it also has the second poorest road quality in the nation, with just 55% of its roads in acceptable condition.
California doesn't fall far behind, ranking as the second worst state for driving. It comes fourth in terms of worst road congestion and carries the unenviable distinction of being the most expensive state for motorists. Drivers here face gas prices of $5 per gallon, yearly maintenance costs of $416 and annual toll costs of $499. These factors firmly place it at the top, despite the state offering some of the nation's cheapest full coverage auto insurance options. Residents of high-cost states might consider comparing quotes from the best car insurance companies to save money on driving costs.
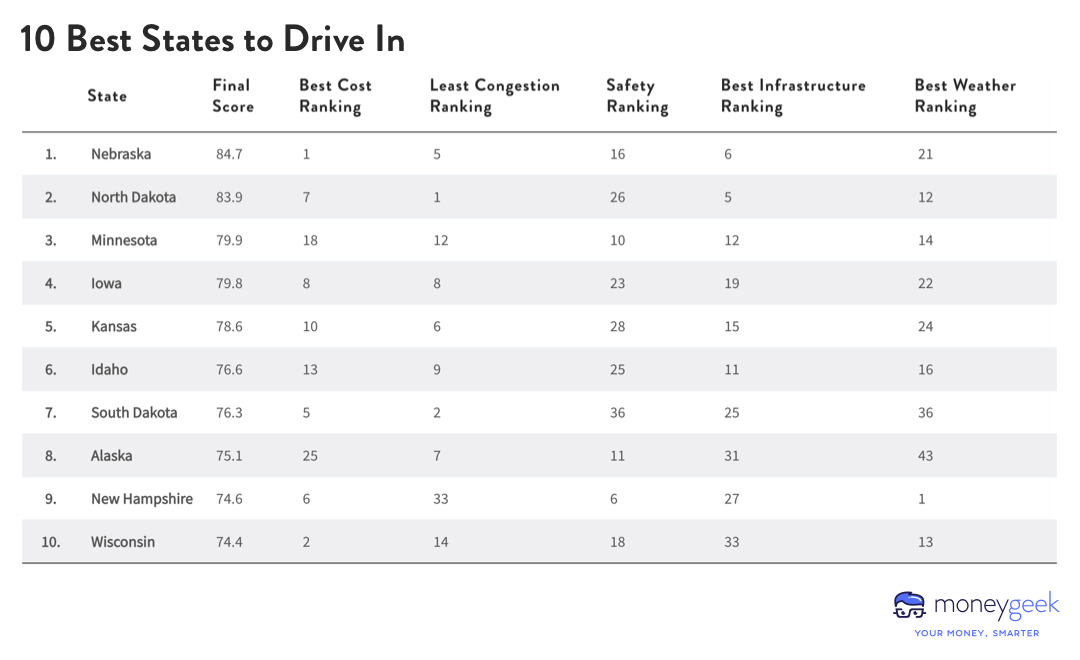
10 best states to drive in
Picture a drive with minimal traffic, smooth highways and economical fuel cost: this isn't a pipe dream, but likely a daily norm for drivers in Nebraska. Claiming the top spot on the list of the best states for drivers, Nebraska offers the most economical car expenses in the country. There, gas costs are just $3.50 per gallon, and the lowest annual insurance premium is a mere $417. With over 90% of its roads and bridges in prime condition, Nebraska also ranks as the sixth-best state for infrastructure quality.
Close behind Nebraska is the No. 2 ranking, North Dakota, which is home to the country's least congested roads. In this state, a morning commute typically takes a brisk 19 minutes.
Going deeper: Congestion, cost, infrastructure, safety and weather rankings
To identify the best and worst states to drive in across the U.S., the study looked at five categories of data that together create a comprehensive view of the driving experience in each location. Those categories include:
- Cost: This category includes factors like gas prices per gallon, annual car maintenance costs and annual toll expenses per vehicle comprise this category; it also includes average annual premiums from the cheapest full coverage auto insurance options available in each state.
- Congestion: This category includes indicators like average morning commute times and vehicle miles traveled per lane mile, which measures how many vehicles are using a particular length of road over a certain period of time.
- Safety: For this category, the study analyzed fatal crashes per 100,000 people and car thefts per 100,000 vehicles.
- Infrastructure: This category includes the percentage of roads and bridges that are in acceptable condition in each state.
- Weather: For this category, the study analyzed the total number of fatal car crashes per 100,000 people in both snowy and rainy conditions.
Within these five categories, the study broke down the best and the worst states across different data points and highlighted them below.
COST
Most expensive states for driving
1. California
2. Delaware
3. Florida
4. Maryland
5. Utah
Least expensive states for driving
1. Nebraska
2. Wisconsin
3. Maine
4. Ohio
5. South Dakota
CONGESTION
States with the most congested roads
1. New Jersey
2. Maryland
3. Hawaii
4. California
5. Massachusetts
States with the least congested roads
1. North Dakota
2. South Dakota
3. Montana
4. Wyoming
5. Nebraska
SAFETY
Most dangerous states
1. Mississippi
2. South Carolina
3. Arkansas
4. Tennessee
5. New Mexico
Safest states
1. New York
2. Massachusetts
3. Hawaii
4. Rhode Island
5. New Jersey
INFRASTRUCTURE
States with the best road infrastructure
1. Rhode Island
2. New Jersey
3. West Virginia
4. Hawaii
5. Connecticut
States with the worst road infrastructure
1. Georgia
2. Tennessee
3. Oklahoma
4. Alabama
5. North Dakota
WEATHER
Least dangerous states for weather-related deaths
1. Wyoming
2. Arkansas
3. West Virginia
4. Kentucky
5. Mississippi
Most dangerous states for weather-related deaths
1. New Hampshire
2. Nevada
3. Arizona
4. California
5. Rhode Island
Methodology
To explore and rank driving experience by state, the study considered 12 metrics across five categories — congestion, cost, infrastructure, safety, and weather. Each metric was assigned a specific weight, which was then used to calculate a final ranking score through a weighted average. Assigned weights are expressed below within parentheses for each metric. The state with the lowest final ranking score ranks as the worst place to drive in.
Cost (20%)
- Gas prices: This is per gallon for mid-grade gas. Data was collected using CollectAPI's Gas Prices API and was accessed in May 2023. (5%)
- Annual toll costs per vehicle: This is government spending on highways funded by toll revenue per state divided by the number of registered vehicles per state. This data comes from the Federal Highway Administration and is for 2020. (5%)
- Annual auto insurance premiums: This is the cheapest full coverage auto insurance options in each state. Data comes from state insurance departments and Quadrant Information Services and reflects the most recent quotes as of July 2023. (5%)
- Annual maintenance costs: Data comes from CarMD and is for 2021. (5%)
Congestion (25%)
- Vehicle miles traveled per lane mile (in thousands): This measures how many vehicles are using a particular length of road over a certain period of time, i.e. traffic density. For this metric, for every single mile-long stretch of a lane, cars in these states cover this amount of miles in a year. Data comes from the Federal Highway Administration and is for 2021. (12.5%)
- Average commute times: Data is expressed in minutes and comes from the Census Bureau's 2021 one-year American Community Survey. (12.5%)
Safety (25%)
- Fatal car crashes per 100,000 people: Number of car crash fatalities divided per 100,000 population. Data comes from the National Highway Traffic Safety Administration and is for 2021. (18.75%)
- Car thefts per 100,000 vehicles: Number of car-theft-related arrests per 100,000 vehicles. Data comes from the Federal Bureau of Investigation's Crime Explorer and is for 2021. (6.25%)
Infrastructure (20%)
- Percentage of roads in acceptable condition: Acceptability of roads is determined based on the International Roughness Index (IRI), with lower IRI values indicating smoother roadways. "Acceptable" in this context is considered an IRI <=170, which includes roadways both rated as "Good" and "Fair". Data comes from the Bureau of Transportation Statistics and is for 2020. (15%)
- Percentage of bridges in acceptable condition: A bridge is considered "acceptable" if it gets a score of at least 5 out of 10. Comparatively, a bridge in excellent shape would score 7 or above, while one in poor condition would get a score of 4 or less. This rating comes from assessing various components of the bridge such as the surface used for walking or driving, the underlying structure, and other elements. Data comes from the Bureau of Transportation Statistics and is for 2022. (5%)
Weather (10%)
- Car fatalities in rainy weather per 100,000 people: Data comes from the National Highway Traffic Safety Administration and is for 2020. (5%)
- Car fatalities in snowy weather per 100,000 people: Data comes from the National Highway Traffic Safety Administration and is for 2020. (5%)
This story was produced by MoneyGeek and reviewed and distributed by Stacker Media.


