832,000 votes: See the demographics of Montana's voting population
832,000 votes: See the demographics of Montana's voting population
In 2020, 158.4 million citizens—almost two-thirds of estimated eligible voters—voted in the presidential elections, according to the Pew Research Center. The number represented a higher than average turnout, with people voting in numbers not seen since 1980 and possibly well before.
Stacker compiled voter demographics for each state and Washington, D.C., using the 2019 U.S. Census Bureau's American Community Survey (released in September 2020). Each slide shows the state's voting-eligible population (citizens who are 18 or older) and the breakdown of that population by sex, age, race, and education. Economic statistics are not included because the American Community Survey does not account for COVID-19, which affected unemployment, poverty, and medical insurance status for millions of Americans. In order to avoid making any assumptions about the data or the participants of the American Community Survey, Stacker used the exact wording of the "race" and "sex" framework that was provided in the census data.
Keep reading to see the voter demographics of your state.
Montana by the numbers
- Voting-eligible population: 831,760
- Breakdown by sex: 49.9% male, 50.1% female
- Breakdown by age: 19.8% 18-29 years old, 23.3% 30-44 years old, 32.0% 45-64 years old, 24.8% 65+ years old
- Breakdown by race: 90.3% White, 0.6% Asian, 3.2% Hispanic or Latino, data not available for other races
- Breakdown by education: 1.6% less than high school education, 5.0% some high school (no diploma), 29.4% high school graduate or equivalency, 24.5% some college (no degree), 8.8% associate's degree, 21.4% bachelor's degree, 9.2% graduate or professional degree
Montana doesn't require residents to provide their race when registering to vote, which is why there is no data on the amount of Native American, Alaskan Native, Native Hawaiian, Pacific Islander, or multiracial voters. However, the Indigenous group makes up 6.7% of the state's almost 1 million populace. Regardless of the lack of data, Native American voters can play a major role in swinging the Big Sky Country State.
By percentage, voters aged 45–64 are the highest in every state, with registered voters over the age of 45 comprising more than half the country's population. Older voters also trend toward turning out to vote at a higher rate and played a significant role in former President Donald Trump's 2016 victory in Florida.
Along racial lines, Black or African American voters in Louisiana and Georgia comprise more than 30% of the state's registered voters. California and Texas—which award the most electoral votes at 55 and 38, respectively—boast the highest numbers of Latino voters. On the other end of the spectrum, West Virginia and Maine boast the highest percentage of white voters. A number of states had already seen record voter turnouts, with 16 seeing more than half of its registered voters casting a ballot before Election Day.
Continue reading for a glimpse into the voter demographics of neighboring states.
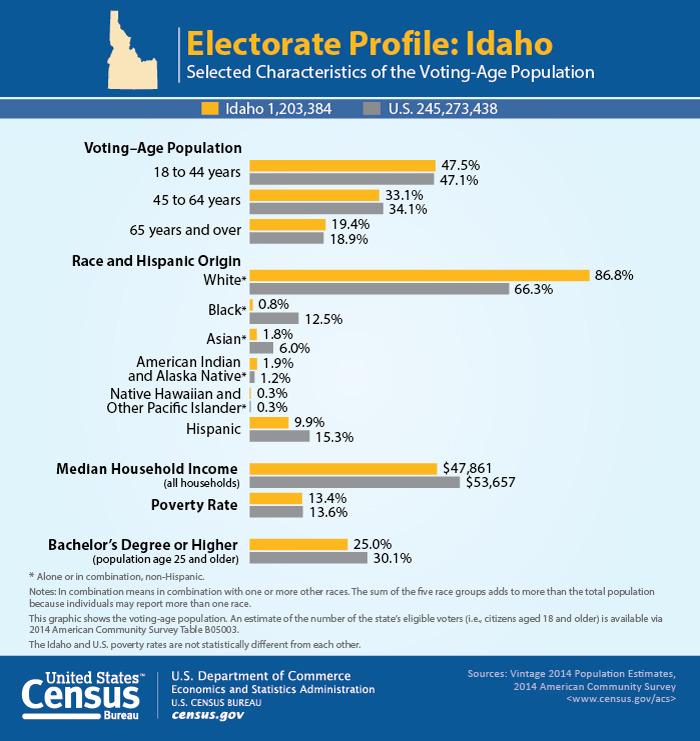
Idaho
- Voting-eligible population: 1,282,630
- Breakdown by sex: 49.6% male, 50.4% female
- Breakdown by age: 21.2% 18-29 years old, 24.9% 30-44 years old, 31.6% 45-64 years old, 22.2% 65+ years old
- Breakdown by race: 91.9% White, 0.5% Black or African American, 1.0% Asian, 8.6% Hispanic or Latino, 0.0% Native American or Alaska Native, 0.0% Native Hawaiian or Pacific Islander, 2.3% two or more races
- Breakdown by education: 1.8% less than high school education, 5.9% some high school (no diploma), 27.5% high school graduate or equivalency, 27.9% some college (no degree), 10.3% associate's degree, 17.8% bachelor's degree, 8.8% graduate or professional degree
Predominantly made up of a white voter population, the Gem State has voted GOP 70% of the time since 1900. The rather red state reported a record turnout in the 2020 primary with up to 38% voting, a number unseen since the 1980 election at a little less than 31%. The 2016 Electorate's Idaho Profile revealed a tied voting population between balloters ages 18–44 and voters between 45–65.
North Dakota
- Voting-eligible population: 567,545
- Breakdown by sex: 51.0% male, 49.0% female
- Breakdown by age: 24.5% 18-29 years old, 25.0% 30-44 years old, 29.4% 45-64 years old, 21.1% 65+ years old
- Breakdown by race: 89.5% White, 2.0% Black or African American, 0.7% Asian, 3.2% Hispanic or Latino, 0.0% Native American or Alaska Native, 0.0% Native Hawaiian or Pacific Islander, 0.0% two or more races
- Breakdown by education: 2.1% less than high school education, 4.4% some high school (no diploma), 26.7% high school graduate or equivalency, 25.2% some college (no degree), 13.7% associate's degree, 20.4% bachelor's degree, 7.5% graduate or professional degree
North Dakota has one of the lowest voting-eligible populations in the U.S. However, the low number does not reflect the collective voter turnout of all communities, including age, sex, race, and education, as up to 64.2% of voting-eligible residents cast ballots in the 2016 general election, compared to the national average turnout of 61.4%.


