Counties in Ohio where people spend most of their paycheck on housing
Counties in Ohio where people spend most of their paycheck on housing
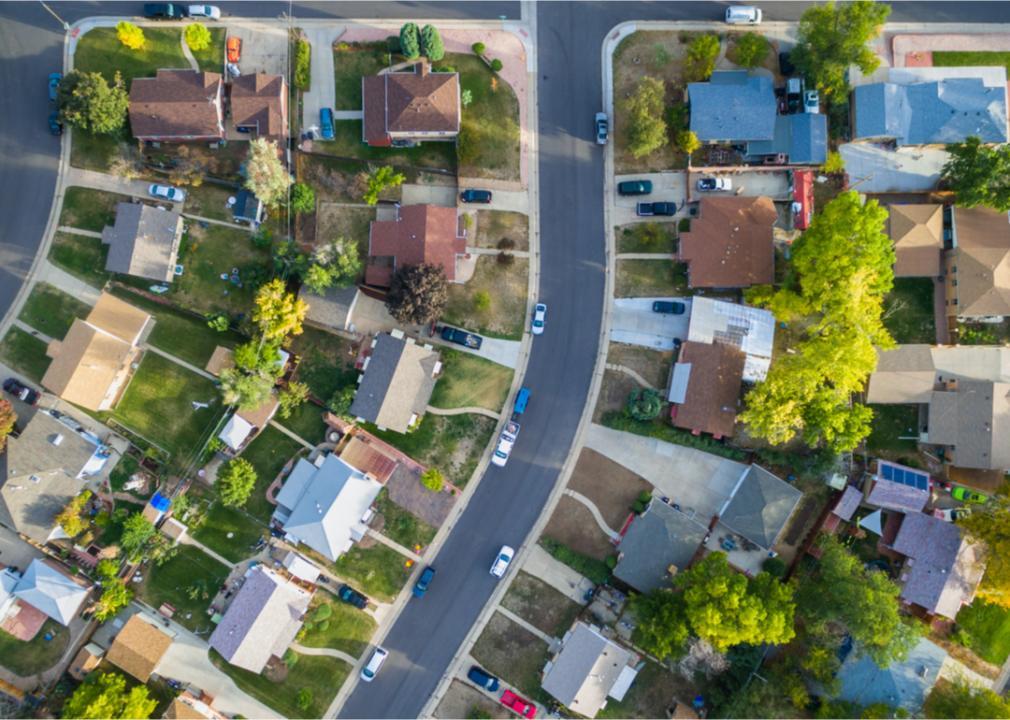
It's no secret that many Americans are forgoing homeownership in favor of renting. In 2020, renters in the U.S. occupied 43 million housing units.
The Stacker team looked at data from a United States Census survey that revealed an estimated 43,378,800 renter-occupied homes in the United States as of 2017, which makes up 36.1% of all households in the country. In 2019, renting was more affordable than buying a median-priced home in 59% of the counties; in 2021, the opposite was true: Owning was more affordable than renting in 63% of U.S. counties.
Stacker compiled a list of counties in Ohio where people spend the highest percent of income on rent using data from the U.S. Census Bureau. Of course, saving money by owning a home is unattainable for many Americans who don't have savings that could cover a down payment, those who are denied a mortgage, or both. Keep reading to see where in your home state most of people's take-home pay goes to their monthly rent.
You may also like: Best places to retire in Ohio
#50. Trumbull County
- Median percent of income spent on housing: 17.0%
--- Percent of households spending <20% of income on housing: 53.2%
--- Percent of households spending >30% of income on housing: 24.9%
- Total occupied households: 85,621
- Median household income: $47,280
- Median monthly housing cost: $668
#49. Union County
- Median percent of income spent on housing: 17.0%
--- Percent of households spending <20% of income on housing: 54.3%
--- Percent of households spending >30% of income on housing: 21.0%
- Total occupied households: 20,212
- Median household income: $86,715
- Median monthly housing cost: $1,227
#48. Perry County
- Median percent of income spent on housing: 17.0%
--- Percent of households spending <20% of income on housing: 52.8%
--- Percent of households spending >30% of income on housing: 24.1%
- Total occupied households: 13,500
- Median household income: $50,150
- Median monthly housing cost: $710
#47. Ashland County
- Median percent of income spent on housing: 17.0%
--- Percent of households spending <20% of income on housing: 55.8%
--- Percent of households spending >30% of income on housing: 21.2%
- Total occupied households: 20,417
- Median household income: $52,823
- Median monthly housing cost: $750
#46. Tuscarawas County
- Median percent of income spent on housing: 17.1%
--- Percent of households spending <20% of income on housing: 56.0%
--- Percent of households spending >30% of income on housing: 21.7%
- Total occupied households: 36,631
- Median household income: $53,243
- Median monthly housing cost: $757
You may also like: Most popular boy names in the 60s in Ohio
#45. Knox County
- Median percent of income spent on housing: 17.1%
--- Percent of households spending <20% of income on housing: 52.8%
--- Percent of households spending >30% of income on housing: 22.9%
- Total occupied households: 23,248
- Median household income: $57,749
- Median monthly housing cost: $824
#44. Madison County
- Median percent of income spent on housing: 17.1%
--- Percent of households spending <20% of income on housing: 55.3%
--- Percent of households spending >30% of income on housing: 19.1%
- Total occupied households: 15,013
- Median household income: $68,022
- Median monthly housing cost: $972
#43. Hancock County
- Median percent of income spent on housing: 17.2%
--- Percent of households spending <20% of income on housing: 56.8%
--- Percent of households spending >30% of income on housing: 20.3%
- Total occupied households: 31,937
- Median household income: $58,450
- Median monthly housing cost: $839
#42. Pickaway County
- Median percent of income spent on housing: 17.2%
--- Percent of households spending <20% of income on housing: 53.2%
--- Percent of households spending >30% of income on housing: 23.0%
- Total occupied households: 19,710
- Median household income: $63,633
- Median monthly housing cost: $914
#41. Richland County
- Median percent of income spent on housing: 17.2%
--- Percent of households spending <20% of income on housing: 53.9%
--- Percent of households spending >30% of income on housing: 24.6%
- Total occupied households: 48,449
- Median household income: $49,547
- Median monthly housing cost: $712
You may also like: Most popular boy names in the 80s in Ohio
#40. Geauga County
- Median percent of income spent on housing: 17.3%
--- Percent of households spending <20% of income on housing: 55.4%
--- Percent of households spending >30% of income on housing: 22.0%
- Total occupied households: 35,298
- Median household income: $82,303
- Median monthly housing cost: $1,186
#39. Greene County
- Median percent of income spent on housing: 17.3%
--- Percent of households spending <20% of income on housing: 53.5%
--- Percent of households spending >30% of income on housing: 23.5%
- Total occupied households: 65,604
- Median household income: $68,720
- Median monthly housing cost: $991
#38. Jackson County
- Median percent of income spent on housing: 17.4%
--- Percent of households spending <20% of income on housing: 51.0%
--- Percent of households spending >30% of income on housing: 25.4%
- Total occupied households: 12,780
- Median household income: $47,550
- Median monthly housing cost: $691
#37. Morrow County
- Median percent of income spent on housing: 17.5%
--- Percent of households spending <20% of income on housing: 56.7%
--- Percent of households spending >30% of income on housing: 19.8%
- Total occupied households: 12,922
- Median household income: $59,452
- Median monthly housing cost: $867
#36. Huron County
- Median percent of income spent on housing: 17.5%
--- Percent of households spending <20% of income on housing: 54.3%
--- Percent of households spending >30% of income on housing: 22.3%
- Total occupied households: 22,935
- Median household income: $52,560
- Median monthly housing cost: $768
You may also like: Do you know Ohio's official state symbols?
#35. Stark County
- Median percent of income spent on housing: 17.6%
--- Percent of households spending <20% of income on housing: 54.2%
--- Percent of households spending >30% of income on housing: 24.0%
- Total occupied households: 153,460
- Median household income: $53,860
- Median monthly housing cost: $788
#34. Brown County
- Median percent of income spent on housing: 17.6%
--- Percent of households spending <20% of income on housing: 52.7%
--- Percent of households spending >30% of income on housing: 24.9%
- Total occupied households: 17,829
- Median household income: $54,575
- Median monthly housing cost: $799
#33. Gallia County
- Median percent of income spent on housing: 17.6%
--- Percent of households spending <20% of income on housing: 54.2%
--- Percent of households spending >30% of income on housing: 22.9%
- Total occupied households: 11,588
- Median household income: $44,858
- Median monthly housing cost: $658
#32. Wood County
- Median percent of income spent on housing: 17.7%
--- Percent of households spending <20% of income on housing: 52.1%
--- Percent of households spending >30% of income on housing: 24.9%
- Total occupied households: 50,589
- Median household income: $62,390
- Median monthly housing cost: $921
#31. Erie County
- Median percent of income spent on housing: 17.7%
--- Percent of households spending <20% of income on housing: 53.5%
--- Percent of households spending >30% of income on housing: 23.2%
- Total occupied households: 31,183
- Median household income: $54,226
- Median monthly housing cost: $801
You may also like: Highest-rated specialty museums in Ohio, according to Tripadvisor
#30. Warren County
- Median percent of income spent on housing: 17.8%
--- Percent of households spending <20% of income on housing: 56.8%
--- Percent of households spending >30% of income on housing: 19.8%
- Total occupied households: 82,957
- Median household income: $87,125
- Median monthly housing cost: $1,294
#29. Ross County
- Median percent of income spent on housing: 17.9%
--- Percent of households spending <20% of income on housing: 52.9%
--- Percent of households spending >30% of income on housing: 25.2%
- Total occupied households: 28,802
- Median household income: $51,092
- Median monthly housing cost: $760
#28. Lake County
- Median percent of income spent on housing: 17.9%
--- Percent of households spending <20% of income on housing: 53.1%
--- Percent of households spending >30% of income on housing: 23.3%
- Total occupied households: 96,361
- Median household income: $64,466
- Median monthly housing cost: $960
#27. Delaware County
- Median percent of income spent on housing: 17.9%
--- Percent of households spending <20% of income on housing: 53.2%
--- Percent of households spending >30% of income on housing: 21.6%
- Total occupied households: 69,985
- Median household income: $106,908
- Median monthly housing cost: $1,594
#26. Clark County
- Median percent of income spent on housing: 18.0%
--- Percent of households spending <20% of income on housing: 52.6%
--- Percent of households spending >30% of income on housing: 24.7%
- Total occupied households: 54,696
- Median household income: $50,873
- Median monthly housing cost: $762
You may also like: Fastest-growing counties in Ohio
#25. Fairfield County
- Median percent of income spent on housing: 18.0%
--- Percent of households spending <20% of income on housing: 52.3%
--- Percent of households spending >30% of income on housing: 25.2%
- Total occupied households: 56,339
- Median household income: $67,609
- Median monthly housing cost: $1,016
#24. Licking County
- Median percent of income spent on housing: 18.1%
--- Percent of households spending <20% of income on housing: 51.8%
--- Percent of households spending >30% of income on housing: 23.7%
- Total occupied households: 64,035
- Median household income: $64,589
- Median monthly housing cost: $976
#23. Butler County
- Median percent of income spent on housing: 18.1%
--- Percent of households spending <20% of income on housing: 51.2%
--- Percent of households spending >30% of income on housing: 25.1%
- Total occupied households: 139,113
- Median household income: $66,117
- Median monthly housing cost: $1,000
#22. Lawrence County
- Median percent of income spent on housing: 18.2%
--- Percent of households spending <20% of income on housing: 49.9%
--- Percent of households spending >30% of income on housing: 26.0%
- Total occupied households: 23,221
- Median household income: $45,118
- Median monthly housing cost: $684
#21. Clermont County
- Median percent of income spent on housing: 18.3%
--- Percent of households spending <20% of income on housing: 52.5%
--- Percent of households spending >30% of income on housing: 23.5%
- Total occupied households: 78,009
- Median household income: $66,968
- Median monthly housing cost: $1,019
You may also like: Highest-rated Class of 2021 football recruits from Ohio
#20. Clinton County
- Median percent of income spent on housing: 18.3%
--- Percent of households spending <20% of income on housing: 51.3%
--- Percent of households spending >30% of income on housing: 25.3%
- Total occupied households: 16,528
- Median household income: $52,815
- Median monthly housing cost: $804
#19. Guernsey County
- Median percent of income spent on housing: 18.3%
--- Percent of households spending <20% of income on housing: 50.5%
--- Percent of households spending >30% of income on housing: 25.6%
- Total occupied households: 16,220
- Median household income: $45,917
- Median monthly housing cost: $699
#18. Lorain County
- Median percent of income spent on housing: 18.3%
--- Percent of households spending <20% of income on housing: 50.4%
--- Percent of households spending >30% of income on housing: 25.9%
- Total occupied households: 120,281
- Median household income: $58,427
- Median monthly housing cost: $892
#17. Ashtabula County
- Median percent of income spent on housing: 18.4%
--- Percent of households spending <20% of income on housing: 50.9%
--- Percent of households spending >30% of income on housing: 27.3%
- Total occupied households: 37,832
- Median household income: $46,700
- Median monthly housing cost: $716
#16. Mahoning County
- Median percent of income spent on housing: 18.4%
--- Percent of households spending <20% of income on housing: 51.3%
--- Percent of households spending >30% of income on housing: 25.7%
- Total occupied households: 98,472
- Median household income: $46,042
- Median monthly housing cost: $707
You may also like: Where people in Ohio are moving to most
#15. Summit County
- Median percent of income spent on housing: 18.7%
--- Percent of households spending <20% of income on housing: 50.8%
--- Percent of households spending >30% of income on housing: 26.5%
- Total occupied households: 224,726
- Median household income: $57,181
- Median monthly housing cost: $889
#14. Marion County
- Median percent of income spent on housing: 18.7%
--- Percent of households spending <20% of income on housing: 51.5%
--- Percent of households spending >30% of income on housing: 26.3%
- Total occupied households: 24,737
- Median household income: $47,498
- Median monthly housing cost: $740
#13. Pike County
- Median percent of income spent on housing: 18.8%
--- Percent of households spending <20% of income on housing: 53.5%
--- Percent of households spending >30% of income on housing: 25.4%
- Total occupied households: 10,959
- Median household income: $42,832
- Median monthly housing cost: $671
#12. Muskingum County
- Median percent of income spent on housing: 18.8%
--- Percent of households spending <20% of income on housing: 51.0%
--- Percent of households spending >30% of income on housing: 26.6%
- Total occupied households: 33,878
- Median household income: $47,254
- Median monthly housing cost: $741
#11. Scioto County
- Median percent of income spent on housing: 18.9%
--- Percent of households spending <20% of income on housing: 50.7%
--- Percent of households spending >30% of income on housing: 26.7%
- Total occupied households: 29,858
- Median household income: $41,330
- Median monthly housing cost: $650
You may also like: Highest-rated things to do in Ohio, according to Tripadvisor
#10. Fayette County
- Median percent of income spent on housing: 18.9%
--- Percent of households spending <20% of income on housing: 51.8%
--- Percent of households spending >30% of income on housing: 25.3%
- Total occupied households: 11,773
- Median household income: $47,308
- Median monthly housing cost: $747
#9. Portage County
- Median percent of income spent on housing: 19.3%
--- Percent of households spending <20% of income on housing: 49.0%
--- Percent of households spending >30% of income on housing: 28.1%
- Total occupied households: 61,817
- Median household income: $57,618
- Median monthly housing cost: $929
#8. Highland County
- Median percent of income spent on housing: 19.9%
--- Percent of households spending <20% of income on housing: 48.8%
--- Percent of households spending >30% of income on housing: 26.0%
- Total occupied households: 16,772
- Median household income: $44,169
- Median monthly housing cost: $733
#7. Adams County
- Median percent of income spent on housing: 19.9%
--- Percent of households spending <20% of income on housing: 45.4%
--- Percent of households spending >30% of income on housing: 26.3%
- Total occupied households: 10,673
- Median household income: $39,079
- Median monthly housing cost: $649
#6. Montgomery County
- Median percent of income spent on housing: 20.0%
--- Percent of households spending <20% of income on housing: 47.9%
--- Percent of households spending >30% of income on housing: 27.8%
- Total occupied households: 224,328
- Median household income: $51,542
- Median monthly housing cost: $857
You may also like: Recipes from Ohio
#5. Lucas County
- Median percent of income spent on housing: 20.1%
--- Percent of households spending <20% of income on housing: 47.1%
--- Percent of households spending >30% of income on housing: 28.5%
- Total occupied households: 179,930
- Median household income: $48,736
- Median monthly housing cost: $817
#4. Hamilton County
- Median percent of income spent on housing: 20.1%
--- Percent of households spending <20% of income on housing: 46.3%
--- Percent of households spending >30% of income on housing: 30.1%
- Total occupied households: 341,873
- Median household income: $57,212
- Median monthly housing cost: $960
#3. Franklin County
- Median percent of income spent on housing: 21.0%
--- Percent of households spending <20% of income on housing: 44.1%
--- Percent of households spending >30% of income on housing: 29.8%
- Total occupied households: 511,447
- Median household income: $61,305
- Median monthly housing cost: $1,073
#2. Cuyahoga County
- Median percent of income spent on housing: 21.1%
--- Percent of households spending <20% of income on housing: 44.4%
--- Percent of households spending >30% of income on housing: 31.1%
- Total occupied households: 540,965
- Median household income: $50,366
- Median monthly housing cost: $884
#1. Athens County
- Median percent of income spent on housing: 22.4%
--- Percent of households spending <20% of income on housing: 44.0%
--- Percent of households spending >30% of income on housing: 31.4%
- Total occupied households: 22,557
- Median household income: $40,905
- Median monthly housing cost: $765
You may also like: Highest-earning counties in Ohio


