Front view of houses on a background of blue sky.
Stacker Studio

Metros with the biggest housing shortages

Written by:
Data work by:
November 27, 2023
Pan_Da // Shutterstock

This story originally appeared on Belong and was produced and distributed in partnership with Stacker Studio.

Metros with the biggest housing shortages

Remote work, COVID-19 pandemic migrations, and more investors are causing a housing shortage that's stopping potential homebuyers from accessing the American dream.

The nation has a shortage of 6.5 million homes, according to a Realtor.com analysis—the result of a nearly decadeslong construction slowdown following the Great Recession. Still, this year, home sales are on track to be at the lowest level since 2008, when the housing bubble burst, according to Redfin.

"It's an affordability issue," Haydar Kurban, Ph.D., director of Howard University's Center of Excellence in Housing and Urban Research, told Stacker. "People cannot find housing with the prices that they can afford."

The pandemic ushered in more Americans working from home, creating the need for employees to have homes with enough space to function as offices. These workers expanded their home searches beyond pricey urban centers and settled in more affordable cities with attractive amenities—the leading reason for home prices increasing 24% between November 2019 and 2021.

Not only are home prices at record levels, but mortgage rates currently hover near 8% after rising two full points in 2023. Even 1 percentage point can increase a monthly payment by hundreds of dollars. Most American homeowners (63%) need mortgages to purchase homes.

Also adding to the housing shortage and competitive market is the influx of investors looking for potential Airbnbs, flips, and rental properties. Investors bought a record high of "18.4% of the U.S. homes that were purchased in the fourth quarter" of 2021, according to a Redfin study.

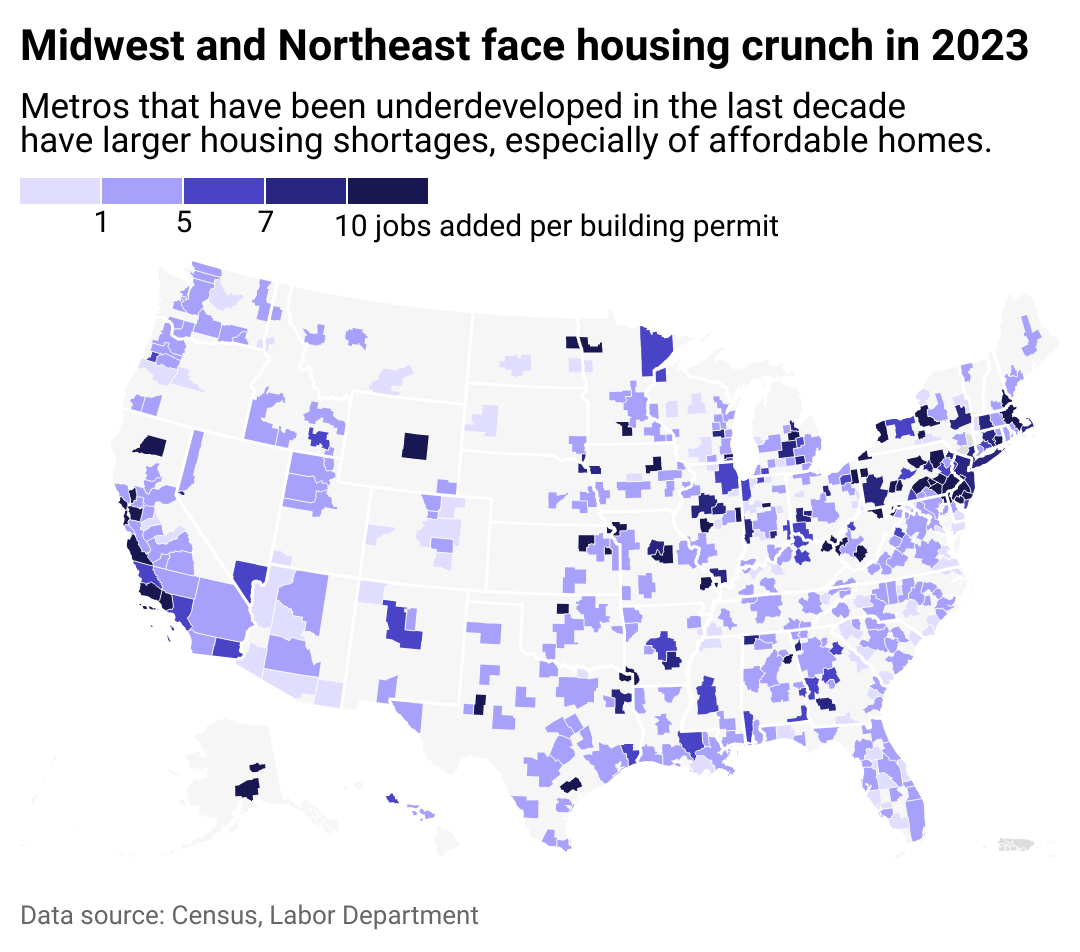
Belong crunched Labor Department and Census data to find out which metros are having the biggest housing shortages.

Shortages were determined by calculating the number of new homes being built for every new job added. Generally, one new housing unit should be built per new job to maintain a balanced housing market. Ratios were determined by dividing the number of jobs added between August 2022 and August 2023 by the number of building permits issued from January to August 2023.

A heat map showing how the Midwest and Northeast fared during the housing crunch of 2023.
1 / 16
Belong

Where shortages are happening

While the housing shortage is a national issue, the reason for the crisis is often a regional or even local issue. For instance, major cities such as New York and San Francisco have stricter regulatory requirements, making it harder for developers to build new homes.

Places plagued with the most acute housing shortages had been experiencing population loss leading up to the pandemic; therefore, builders were not putting up new properties. But most people who moved during the height of the pandemic found refuge in these smaller counties.

These migratory patterns made housing in the new locations more competitive.

To combat the affordability problem, federal and local governments are making moves to increase home construction. The Biden administration announced a plan in October 2023 to encourage the conversion of office space to housing; the month before, New York City proposed making it easier to build by lifting zoning restrictions and easing mandates.

Below are the 15 metropolitan areas with the most severe housing shortages. Metros needed at least 50 housing units under construction to be ranked.

A view of Williamsport, Pennsylvania, from a mountain lookout.
2 / 16
CEW // Shutterstock

#15. Williamsport, Pennsylvania

- Job-to-housing permit ratio: 16.4
-- 61 permits issued
-- 1,000 jobs added

Youngstown downtown skyline at twilight.
3 / 16
Sean Pavone // Shutterstock

#14. Youngstown, Ohio

- Job-to-housing permit ratio: 16.8
-- 191 permits issued
-- 3,200 jobs added

Aerial view of Trenton, New Jersey.
4 / 16
FotosForTheFuture // Shutterstock

#13. Trenton, New Jersey

- Job-to-housing permit ratio: 17.1
-- 755 permits issued
-- 12,900 jobs added

Aerial view of Manhattan in summer.
5 / 16
Jacob Boomsma // Shutterstock

#12. Manhattan, Kansas

- Job-to-housing permit ratio: 17.1
-- 187 permits issued
-- 3,200 jobs added

Afternoon aerial view of downtown Salinas, California.
6 / 16
Matt Gush // Shutterstock

#11. Salinas, California

- Job-to-housing permit ratio: 17.7
-- 356 permits issued
-- 6,300 jobs added

Daytime skyline of Syracuse, New York.
7 / 16
Paul Brady Photography // Shutterstock

#10. Syracuse, New York

- Job-to-housing permit ratio: 18.0
-- 350 permits issued
-- 6,300 jobs added

Aerial view of Lawrence, Kansas, and State University.
8 / 16
Jacob Boomsma // Shutterstock

#9. Lawrence, Kansas

- Job-to-housing permit ratio: 18.2
-- 132 permits issued
-- 2,400 jobs added

Illinois State Capitol from East Capitol Avenue.
9 / 16
Paul Brady Photography // Shutterstock

#8. Springfield, Illinois

- Job-to-housing permit ratio: 19.3
-- 114 permits issued
-- 2,200 jobs added

Aerial view of Jefferson City, Missouri, and its capital building.
10 / 16
Mike Gattorna // Shutterstock

#7. Jefferson City, Missouri

- Job-to-housing permit ratio: 24.0
-- 125 permits issued
-- 3,000 jobs added

Felix Street Square in downtown St. Joseph, Missouri.
11 / 16
APN Photography // Shutterstock

#6. St. Joseph, Missouri

- Job-to-housing permit ratio: 24.1
-- 54 permits issued
-- 1,300 jobs added

Clock and golden dome of Huntington, West Virginia.
12 / 16
Dee Browning // Shutterstock

#5. Huntington, West Virginia

- Job-to-housing permit ratio: 24.3
-- 177 permits issued
-- 4,300 jobs added

New home under construction in Vineland, New Jersey.
13 / 16
Racheal Grazias // Shutterstock

#4. Vineland, New Jersey

- Job-to-housing permit ratio: 24.4
-- 78 permits issued
-- 1,900 jobs added

Downtown Cape Girardeau during Christmas with decorations.
14 / 16
Steven Liveoak // Shutterstock

#3. Cape Girardeau, Missouri

- Job-to-housing permit ratio: 25.5
-- 51 permits issued
-- 1,300 jobs added

Aerial view of a sunset over downtown Anchorage, Alaska.
15 / 16
Jacob Boomsma // Shutterstock

#2. Anchorage, Alaska

- Job-to-housing permit ratio: 26.1
-- 276 permits issued
-- 7,200 jobs added

Statue of Christopher Columbus in front of the Lackawanna County Courthouse.
16 / 16
quiggyt4 // Shutterstock

#1. Scranton, Pennsylvania

- Job-to-housing permit ratio: 26.9
-- 346 permits issued
-- 9,300 jobs added

Story editing by Ashleigh Graf. Copy editing by Paris Close. Photo selection by Clarese Moller.

Trending Now