
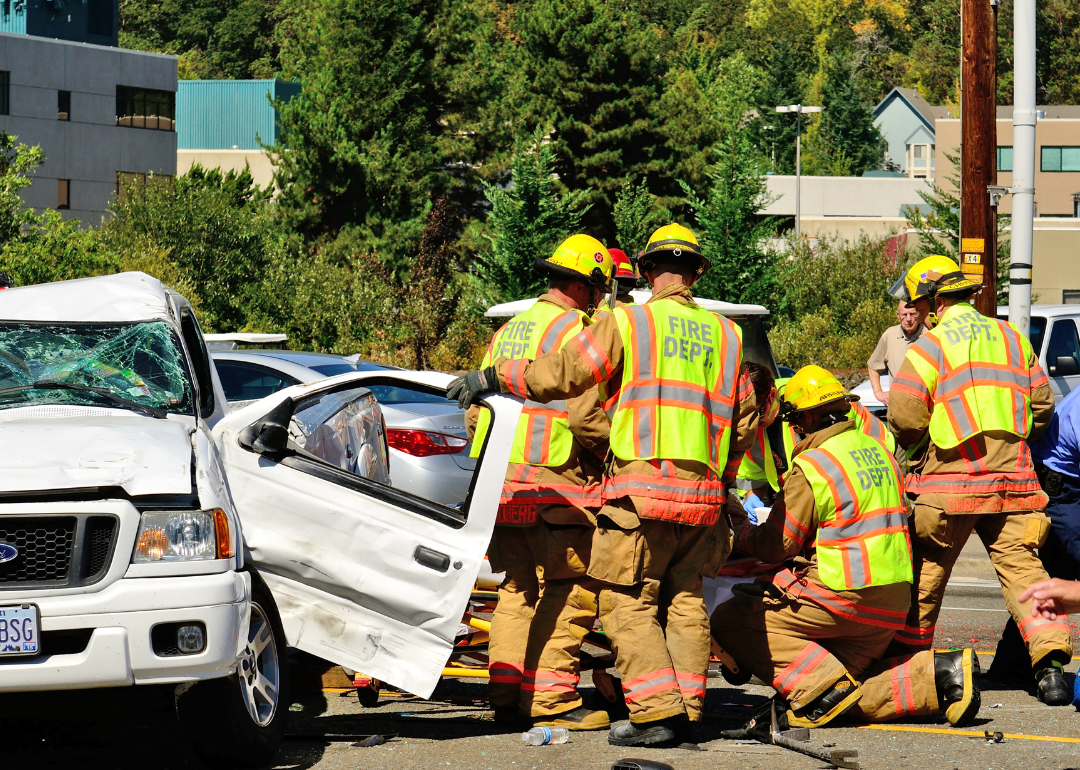
Cities with the highest rate of motor vehicle fatalities
American roads haven't been this deadly since 2007. And the situation isn't getting any better; in fact, it may be getting worse. Across the U.S., nearly 39,000 people died in traffic crashes in 2020, amounting to about 11.78 deaths per 100,000 residents. Two in three deaths were vehicle occupants, while nearly 1 in 5 were pedestrians or cyclists.
Stacker used Department of Transportation data to rank the 50 cities with the highest motor vehicle crash fatality rates in 2020—the most recent data available—and broke ties by the total number of fatalities. Only cities with a population of at least 150,000 were considered.
When new data is released, it could show that roadways became even deadlier in 2021 and stayed similarly deadly in 2022.
The National Highway Traffic Safety Administration estimates that 2021 roadway fatalities grew by 10.5% from 2020, marking a 16-year high and the largest year-over-year increase since the agency began capturing data. Crashes involving more than one vehicle and those that occur on city roads as opposed to rural ones grew the most, according to those estimates. The projection also points to an increase in deaths on roadways during the day and for those who are older than 65.
The latest estimates reflect a public health crisis that officials at the traffic safety agency have called "urgent and preventable." The biggest contributing factor to fatal car wrecks is the speed of the vehicle. In 2020, NHTSA recorded more than 11,000 deaths as a result of speeding.
Surveys also reveal that drivers admit they have increasingly taken part in risky driving behaviors in recent years. According to a AAA survey of drivers in 2021, 12% more drivers said they drove significantly faster than the speed limit, and roughly 24% more drivers admitted to driving under the influence compared with the year prior. The association condemned the growth in risky driving behaviors as "disturbing."
Psychologists have also pointed to stress associated with the pandemic as a potential factor in the increase in traffic fatalities.
Many of the cities that rank among the most deadly according to 2020 data are located in the southern U.S. Read on to see where your city ranks on this list.
#50. Oklahoma City
- Motor vehicle crash fatalities: 12.23 per 100,000 residents (81 total)
- Pedestrian fatalities from vehicle crashes: 3.77 per 100,000 residents (25 total)
#49. Salt Lake City
- Motor vehicle crash fatalities: 12.25 per 100,000 residents (25 total)
- Pedestrian fatalities from vehicle crashes: 1.96 per 100,000 residents (4 total)
#48. Wichita, Kansas
- Motor vehicle crash fatalities: 12.25 per 100,000 residents (48 total)
- Pedestrian fatalities from vehicle crashes: 1.28 per 100,000 residents (5 total)
#47. Newport News, Virginia
- Motor vehicle crash fatalities: 12.29 per 100,000 residents (22 total)
- Pedestrian fatalities from vehicle crashes: 1.68 per 100,000 residents (3 total)
#46. St. Petersburg, Florida
- Motor vehicle crash fatalities: 12.70 per 100,000 residents (34 total)
- Pedestrian fatalities from vehicle crashes: 2.24 per 100,000 residents (6 total)
#45. Miami
- Motor vehicle crash fatalities: 12.72 per 100,000 residents (60 total)
- Pedestrian fatalities from vehicle crashes: 4.45 per 100,000 residents (21 total)
#44. Montgomery, Alabama
- Motor vehicle crash fatalities: 12.74 per 100,000 residents (25 total)
- Pedestrian fatalities from vehicle crashes: 4.08 per 100,000 residents (8 total)
#43. Huntsville, Alabama
- Motor vehicle crash fatalities: 12.81 per 100,000 residents (26 total)
- Pedestrian fatalities from vehicle crashes: 3.94 per 100,000 residents (8 total)
#42. Toledo, Ohio
- Motor vehicle crash fatalities: 12.89 per 100,000 residents (35 total)
- Pedestrian fatalities from vehicle crashes: 2.21 per 100,000 residents (6 total)
#41. New Orleans
- Motor vehicle crash fatalities: 13.09 per 100,000 residents (51 total)
- Pedestrian fatalities from vehicle crashes: 2.57 per 100,000 residents (10 total)
#40. Phoenix
- Motor vehicle crash fatalities: 13.11 per 100,000 residents (224 total)
- Pedestrian fatalities from vehicle crashes: 4.27 per 100,000 residents (73 total)
#39. Bakersfield, California
- Motor vehicle crash fatalities: 13.22 per 100,000 residents (51 total)
- Pedestrian fatalities from vehicle crashes: 3.63 per 100,000 residents (14 total)
#38. Fresno, California
- Motor vehicle crash fatalities: 13.39 per 100,000 residents (71 total)
- Pedestrian fatalities from vehicle crashes: 5.47 per 100,000 residents (29 total)
#37. Augusta-Richmond County consolidated government, Georgia
- Motor vehicle crash fatalities: 13.67 per 100,000 residents (27 total)
- Pedestrian fatalities from vehicle crashes: 5.06 per 100,000 residents (10 total)
#36. Tulsa, Oklahoma
- Motor vehicle crash fatalities: 14.63 per 100,000 residents (59 total)
- Pedestrian fatalities from vehicle crashes: 3.97 per 100,000 residents (16 total)
#35. Fayetteville, North Carolina
- Motor vehicle crash fatalities: 14.64 per 100,000 residents (31 total)
- Pedestrian fatalities from vehicle crashes: 6.14 per 100,000 residents (13 total)
#34. Milwaukee
- Motor vehicle crash fatalities: 14.77 per 100,000 residents (87 total)
- Pedestrian fatalities from vehicle crashes: 2.55 per 100,000 residents (15 total)
#33. Akron, Ohio
- Motor vehicle crash fatalities: 14.80 per 100,000 residents (29 total)
- Pedestrian fatalities from vehicle crashes: 2.04 per 100,000 residents (4 total)
#32. Hollywood, Florida
- Motor vehicle crash fatalities: 14.88 per 100,000 residents (23 total)
- Pedestrian fatalities from vehicle crashes: 2.59 per 100,000 residents (4 total)
#31. Mobile, Alabama
- Motor vehicle crash fatalities: 14.91 per 100,000 residents (28 total)
- Pedestrian fatalities from vehicle crashes: 2.66 per 100,000 residents (5 total)
#30. Kansas City, Kansas
- Motor vehicle crash fatalities: 15.06 per 100,000 residents (23 total)
- Pedestrian fatalities from vehicle crashes: 2.62 per 100,000 residents (4 total)
#29. Indianapolis
- Motor vehicle crash fatalities: 15.26 per 100,000 residents (134 total)
- Pedestrian fatalities from vehicle crashes: 4.44 per 100,000 residents (39 total)
#28. Nashville-Davidson metro, Tennessee
- Motor vehicle crash fatalities: 15.49 per 100,000 residents (104 total)
- Pedestrian fatalities from vehicle crashes: 5.51 per 100,000 residents (37 total)
#27. Orlando, Florida
- Motor vehicle crash fatalities: 15.55 per 100,000 residents (45 total)
- Pedestrian fatalities from vehicle crashes: 3.80 per 100,000 residents (11 total)
#26. Tampa, Florida
- Motor vehicle crash fatalities: 15.70 per 100,000 residents (64 total)
- Pedestrian fatalities from vehicle crashes: 3.43 per 100,000 residents (14 total)
#25. Knoxville, Tennessee
- Motor vehicle crash fatalities: 15.77 per 100,000 residents (30 total)
- Pedestrian fatalities from vehicle crashes: 2.63 per 100,000 residents (5 total)
#24. Atlanta
- Motor vehicle crash fatalities: 15.80 per 100,000 residents (81 total)
- Pedestrian fatalities from vehicle crashes: 4.88 per 100,000 residents (25 total)
#23. Dallas
- Motor vehicle crash fatalities: 16.53 per 100,000 residents (222 total)
- Pedestrian fatalities from vehicle crashes: 4.91 per 100,000 residents (66 total)
#22. Shreveport, Louisiana
- Motor vehicle crash fatalities: 16.78 per 100,000 residents (31 total)
- Pedestrian fatalities from vehicle crashes: 4.33 per 100,000 residents (8 total)
#21. Springfield, Missouri
- Motor vehicle crash fatalities: 17.25 per 100,000 residents (29 total)
- Pedestrian fatalities from vehicle crashes: 3.57 per 100,000 residents (6 total)
#20. Palmdale, California
- Motor vehicle crash fatalities: 17.28 per 100,000 residents (26 total)
- Pedestrian fatalities from vehicle crashes: 3.99 per 100,000 residents (6 total)
#19. Kansas City, Missouri
- Motor vehicle crash fatalities: 17.70 per 100,000 residents (88 total)
- Pedestrian fatalities from vehicle crashes: 3.22 per 100,000 residents (16 total)
#18. Lancaster, California
- Motor vehicle crash fatalities: 17.97 per 100,000 residents (28 total)
- Pedestrian fatalities from vehicle crashes: 5.13 per 100,000 residents (8 total)
#17. Louisville-Jefferson County metro, Kentucky
- Motor vehicle crash fatalities: 18.27 per 100,000 residents (113 total)
- Pedestrian fatalities from vehicle crashes: 5.01 per 100,000 residents (31 total)
#16. Chattanooga, Tennessee
- Motor vehicle crash fatalities: 18.40 per 100,000 residents (34 total)
- Pedestrian fatalities from vehicle crashes: 1.08 per 100,000 residents (2 total)
#15. Fort Lauderdale, Florida
- Motor vehicle crash fatalities: 18.45 per 100,000 residents (34 total)
- Pedestrian fatalities from vehicle crashes: 5.43 per 100,000 residents (10 total)
#14. Albuquerque, New Mexico
- Motor vehicle crash fatalities: 18.67 per 100,000 residents (105 total)
- Pedestrian fatalities from vehicle crashes: 5.33 per 100,000 residents (30 total)

#13. Macon-Bibb County, Georgia
- Motor vehicle crash fatalities: 18.99 per 100,000 residents (29 total)
- Pedestrian fatalities from vehicle crashes: 4.58 per 100,000 residents (7 total)
#12. Glendale, Arizona
- Motor vehicle crash fatalities: 19.19 per 100,000 residents (49 total)
- Pedestrian fatalities from vehicle crashes: 5.88 per 100,000 residents (15 total)
#11. Jacksonville, Florida
- Motor vehicle crash fatalities: 19.34 per 100,000 residents (178 total)
- Pedestrian fatalities from vehicle crashes: 4.89 per 100,000 residents (45 total)
#10. Cleveland
- Motor vehicle crash fatalities: 19.81 per 100,000 residents (75 total)
- Pedestrian fatalities from vehicle crashes: 2.64 per 100,000 residents (10 total)
#9. San Bernardino, California
- Motor vehicle crash fatalities: 20.69 per 100,000 residents (45 total)
- Pedestrian fatalities from vehicle crashes: 5.52 per 100,000 residents (12 total)
#8. Birmingham, Alabama
- Motor vehicle crash fatalities: 21.26 per 100,000 residents (44 total)
- Pedestrian fatalities from vehicle crashes: 4.35 per 100,000 residents (9 total)
#7. Little Rock, Arkansas
- Motor vehicle crash fatalities: 21.73 per 100,000 residents (43 total)
- Pedestrian fatalities from vehicle crashes: 10.11 per 100,000 residents (20 total)
#6. Tucson, Arizona
- Motor vehicle crash fatalities: 22.58 per 100,000 residents (125 total)
- Pedestrian fatalities from vehicle crashes: 6.68 per 100,000 residents (37 total)
#5. Baton Rouge, Louisiana
- Motor vehicle crash fatalities: 26.48 per 100,000 residents (58 total)
- Pedestrian fatalities from vehicle crashes: 9.13 per 100,000 residents (20 total)
#4. St. Louis
- Motor vehicle crash fatalities: 27.21 per 100,000 residents (81 total)
- Pedestrian fatalities from vehicle crashes: 6.72 per 100,000 residents (20 total)
#3. Detroit
- Motor vehicle crash fatalities: 28.71 per 100,000 residents (191 total)
- Pedestrian fatalities from vehicle crashes: 6.16 per 100,000 residents (41 total)
#2. Jackson, Mississippi
- Motor vehicle crash fatalities: 33.58 per 100,000 residents (53 total)
- Pedestrian fatalities from vehicle crashes: 9.50 per 100,000 residents (15 total)
#1. Memphis, Tennessee
- Motor vehicle crash fatalities: 34.32 per 100,000 residents (223 total)
- Pedestrian fatalities from vehicle crashes: 9.70 per 100,000 residents (63 total)