Counties with the most pre-war homes in South Carolina
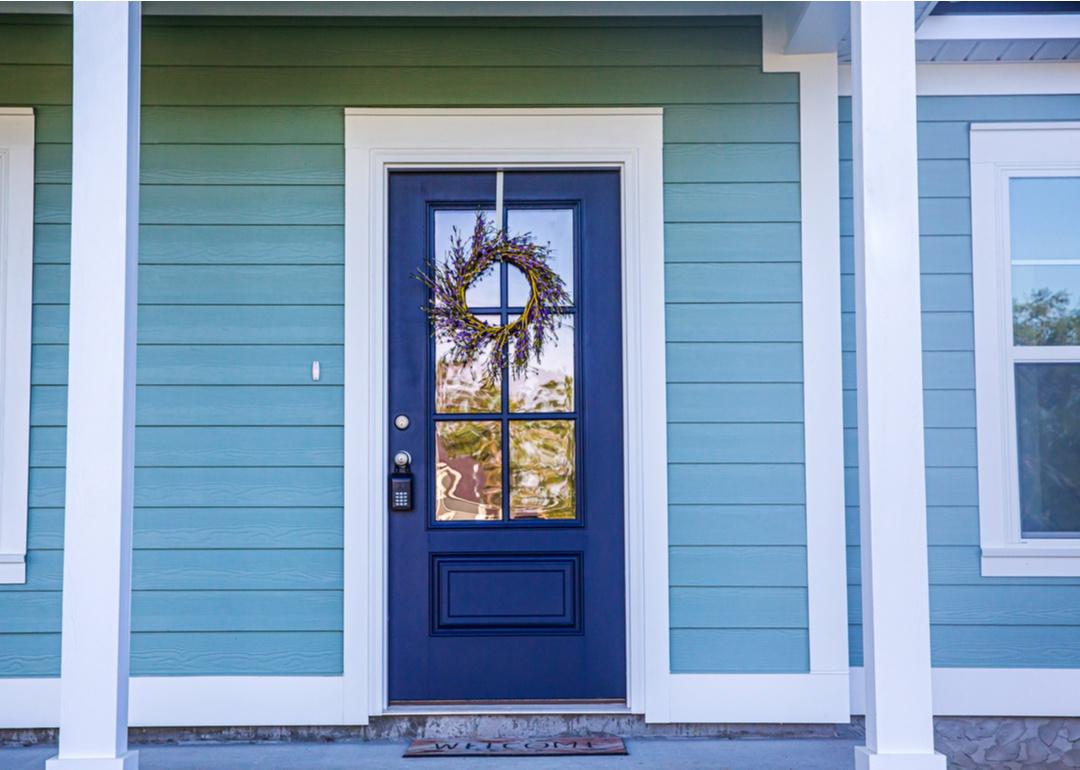
Pre-war homes—those built before 1939—are architectural gems. They are sturdy, charming, and often what people are referring to when they look at the prevalent colorless, linear designs of today and lament "they just don't make them like they used to."
In some ways, that's a good thing. Pre-war homes often contained materials we know to be hazardous today, like asbestos and lead. But their signature characteristics, including hardwood floors, nickel accents, ornate crown molding, and high ceilings, are among the features many people look for in a dream home.
Preserving the history of these properties, many of which you'll find on the National Register of Historic Places, is labor that often extends beyond the scope of an individual homeowner. Depending on where these homes are located, special permission by local historic commissions may be required before renovations can be done in an effort to preserve their historic architectural integrity.
Stacker compiled a list of counties in South Carolina with the most pre-war homes using data from the U.S. Census Bureau. Counties are ranked by the highest percent of homes that were built in 1939 or earlier based on 2023 5-year estimates.
#46. Berkeley County
- Homes built since 2000: 5.1% (4,958 homes)
- Median year homes built: 2000
- National rank: #3,093
- Total homes built: 97,512
#45. Horry County
- Homes built since 2000: 2.6% (5,577 homes)
- Median year homes built: 1998
- National rank: #3,090
- Total homes built: 211,686
#44. Beaufort County
- Homes built since 2000: 2.0% (1,981 homes)
- Median year homes built: 1997
- National rank: #3,086
- Total homes built: 101,177
#43. Dorchester County
- Homes built since 2000: 2.6% (1,699 homes)
- Median year homes built: 1999
- National rank: #3,040
- Total homes built: 66,435
#42. Lee County
- Homes built since 2000: 0.8% (61 homes)
- Median year homes built: 1982
- National rank: #2,991
- Total homes built: 7,587
#41. Lexington County
- Homes built since 2000: 2.1% (2,716 homes)
- Median year homes built: 1992
- National rank: #2,950
- Total homes built: 130,874
#40. York County
- Homes built since 2000: 2.4% (2,844 homes)
- Median year homes built: 1999
- National rank: #2,840
- Total homes built: 118,063
#39. Clarendon County
- Homes built since 2000: 1.0% (155 homes)
- Median year homes built: 1989
- National rank: #2,824
- Total homes built: 16,009
#38. Kershaw County
- Homes built since 2000: 1.5% (444 homes)
- Median year homes built: 1991
- National rank: #2,819
- Total homes built: 29,623
#37. Georgetown County
- Homes built since 2000: 1.6% (602 homes)
- Median year homes built: 1991
- National rank: #2,807
- Total homes built: 36,704
#36. Colleton County
- Homes built since 2000: 0.9% (186 homes)
- Median year homes built: 1988
- National rank: #2,797
- Total homes built: 19,994
#35. Florence County
- Homes built since 2000: 1.2% (712 homes)
- Median year homes built: 1985
- National rank: #2,771
- Total homes built: 61,418
#34. Greenville County
- Homes built since 2000: 3.0% (6,910 homes)
- Median year homes built: 1992
- National rank: #2,763
- Total homes built: 233,254
#33. Sumter County
- Homes built since 2000: 1.6% (735 homes)
- Median year homes built: 1987
- National rank: #2,730
- Total homes built: 47,288
#32. Lancaster County
- Homes built since 2000: 4.0% (1,722 homes)
- Median year homes built: 1998
- National rank: #2,712
- Total homes built: 42,696
#31. Oconee County
- Homes built since 2000: 1.8% (727 homes)
- Median year homes built: 1990
- National rank: #2,651
- Total homes built: 41,514
#30. Anderson County
- Homes built since 2000: 1.6% (1,490 homes)
- Median year homes built: 1987
- National rank: #2,638
- Total homes built: 91,008
#29. Aiken County
- Homes built since 2000: 1.6% (1,231 homes)
- Median year homes built: 1988
- National rank: #2,570
- Total homes built: 78,715
#28. Pickens County
- Homes built since 2000: 1.5% (882 homes)
- Median year homes built: 1989
- National rank: #2,553
- Total homes built: 57,695
#27. Richland County
- Homes built since 2000: 1.3% (2,463 homes)
- Median year homes built: 1989
- National rank: #2,548
- Total homes built: 185,196
#26. Orangeburg County
- Homes built since 2000: 0.7% (280 homes)
- Median year homes built: 1982
- National rank: #2,543
- Total homes built: 41,420
#25. Allendale County
- Homes built since 2000: 1.1% (45 homes)
- Median year homes built: 1981
- National rank: #2,514
- Total homes built: 4,055
#24. Hampton County
- Homes built since 2000: 0.5% (43 homes)
- Median year homes built: 1986
- National rank: #2,493
- Total homes built: 8,622
#23. Darlington County
- Homes built since 2000: 0.5% (152 homes)
- Median year homes built: 1983
- National rank: #2,491
- Total homes built: 29,645
#22. Williamsburg County
- Homes built since 2000: 1.1% (157 homes)
- Median year homes built: 1985
- National rank: #2,473
- Total homes built: 14,837
#21. McCormick County
- Homes built since 2000: 1.3% (71 homes)
- Median year homes built: 1982
- National rank: #2,462
- Total homes built: 5,563
#20. Cherokee County
- Homes built since 2000: 2.7% (667 homes)
- Median year homes built: 1982
- National rank: #2,451
- Total homes built: 24,945
#19. Jasper County
- Homes built since 2000: 5.8% (801 homes)
- Median year homes built: 2002
- National rank: #2,431
- Total homes built: 13,868
#18. Laurens County
- Homes built since 2000: 1.3% (410 homes)
- Median year homes built: 1984
- National rank: #2,413
- Total homes built: 31,695
#17. Charleston County
- Homes built since 2000: 1.9% (3,959 homes)
- Median year homes built: 1991
- National rank: #2,376
- Total homes built: 206,299
#16. Chesterfield County
- Homes built since 2000: 1.6% (323 homes)
- Median year homes built: 1986
- National rank: #2,326
- Total homes built: 20,655
#15. Spartanburg County
- Homes built since 2000: 3.3% (4,663 homes)
- Median year homes built: 1989
- National rank: #2,296
- Total homes built: 141,086
#14. Barnwell County
- Homes built since 2000: 0.5% (48 homes)
- Median year homes built: 1984
- National rank: #2,274
- Total homes built: 9,901
#13. Dillon County
- Homes built since 2000: 0.6% (77 homes)
- Median year homes built: 1984
- National rank: #2,256
- Total homes built: 12,879
#12. Marion County
- Homes built since 2000: 0.9% (127 homes)
- Median year homes built: 1983
- National rank: #2,244
- Total homes built: 14,418
#11. Edgefield County
- Homes built since 2000: 3.4% (389 homes)
- Median year homes built: 1988
- National rank: #2,075
- Total homes built: 11,317
#10. Calhoun County
- Homes built since 2000: 2.2% (154 homes)
- Median year homes built: 1989
- National rank: #1,952
- Total homes built: 7,061
#9. Fairfield County
- Homes built since 2000: 1.2% (134 homes)
- Median year homes built: 1982
- National rank: #1,941
- Total homes built: 10,957
#8. Abbeville County
- Homes built since 2000: 1.0% (122 homes)
- Median year homes built: 1979
- National rank: #1,802
- Total homes built: 11,718
#7. Bamberg County
- Homes built since 2000: 0.8% (56 homes)
- Median year homes built: 1977
- National rank: #1,784
- Total homes built: 6,598
#6. Greenwood County
- Homes built since 2000: 0.8% (266 homes)
- Median year homes built: 1976
- National rank: #1,774
- Total homes built: 31,549
#5. Marlboro County
- Homes built since 2000: 0.0% (3 homes)
- Median year homes built: 1978
- National rank: #1,770
- Total homes built: 12,059
#4. Saluda County
- Homes built since 2000: 1.5% (142 homes)
- Median year homes built: 1987
- National rank: #1,733
- Total homes built: 9,420
#3. Chester County
- Homes built since 2000: 0.8% (113 homes)
- Median year homes built: 1978
- National rank: #1,663
- Total homes built: 14,717
#2. Newberry County
- Homes built since 2000: 0.9% (157 homes)
- Median year homes built: 1981
- National rank: #1,630
- Total homes built: 18,398
#1. Union County
- Homes built since 2000: 0.5% (64 homes)
- Median year homes built: 1973
- National rank: #1,374
- Total homes built: 13,508


