Counties with the worst commutes in South Carolina
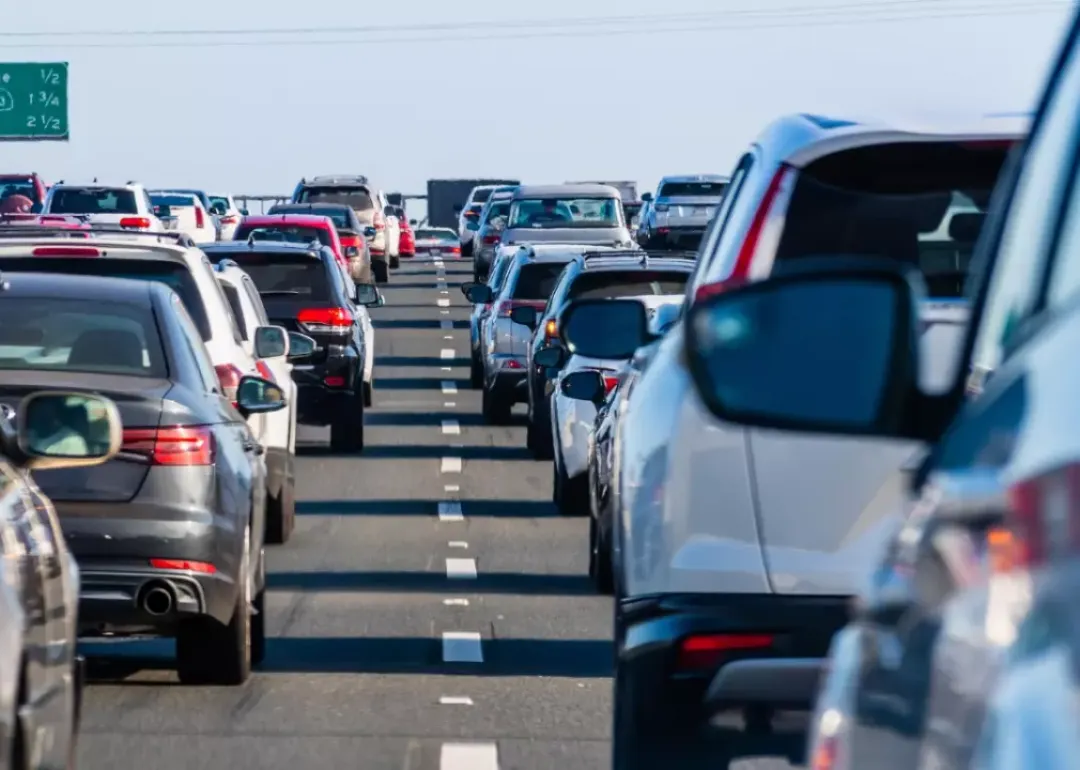
Commuting easily ranks as one of the least enjoyable parts of a person's day. Commuters encounter more physical health problems, and low-income commuters are less likely to gain financial stability—among a host of other negative impacts. And yet, America's commutes keep getting longer as people move farther away from the office, according to Census Bureau data.
Stacker compiled a list of counties with the worst commutes in South Carolina, using 2021 data from the Census Bureau. Counties are ranked by longest average commute time in 2021 among workers over the age of 16, excluding those who work from home. Think you have a long trip to work? Read on to compare it against the worst commutes statewide.
#46. Greenwood County
- Average commute to work: 20.3 minutes
- Share with commutes over an hour: 5.8%
- Share that worked outside their county of residence: 19.1%
- Means of transportation to work:
--- Drove alone: 86.1%
--- Carpooled: 10.1%
--- Public transportation: 0.3%
--- Walked: 0.9%
--- Bicycle: 0%
--- Taxicab, motorcycle, or other means: 0.4%
--- Worked from home: 2.4%
#45. Horry County
- Average commute to work: 22.5 minutes
- Share with commutes over an hour: 4.2%
- Share that worked outside their county of residence: 4.9%
- Means of transportation to work:
--- Drove alone: 80.8%
--- Carpooled: 8.1%
--- Public transportation: 0.4%
--- Walked: 1.3%
--- Bicycle: 0.2%
--- Taxicab, motorcycle, or other means: 1.7%
--- Worked from home: 7.5%
#44. Dillon County
- Average commute to work: 22.6 minutes
- Share with commutes over an hour: 4.8%
- Share that worked outside their county of residence: 29.1%
- Means of transportation to work:
--- Drove alone: 80.7%
--- Carpooled: 14.5%
--- Public transportation: 0%
--- Walked: 0.4%
--- Bicycle: 0%
--- Taxicab, motorcycle, or other means: 0.7%
--- Worked from home: 3.8%
#42. Florence County (tie)
- Average commute to work: 22.7 minutes
- Share with commutes over an hour: 6.2%
- Share that worked outside their county of residence: 15.5%
- Means of transportation to work:
--- Drove alone: 81.9%
--- Carpooled: 9.2%
--- Public transportation: 0.3%
--- Walked: 0.7%
--- Bicycle: 0.2%
--- Taxicab, motorcycle, or other means: 0.9%
--- Worked from home: 6.8%
#42. Sumter County (tie)
- Average commute to work: 22.7 minutes
- Share with commutes over an hour: 8.8%
- Share that worked outside their county of residence: 19%
- Means of transportation to work:
--- Drove alone: 85.4%
--- Carpooled: 8.4%
--- Public transportation: 0.2%
--- Walked: 1.7%
--- Bicycle: 0.2%
--- Taxicab, motorcycle, or other means: 1%
--- Worked from home: 3.1%
#40. Beaufort County (tie)
- Average commute to work: 22.8 minutes
- Share with commutes over an hour: 5.4%
- Share that worked outside their county of residence: 4.8%
- Means of transportation to work:
--- Drove alone: 76.1%
--- Carpooled: 9.6%
--- Public transportation: 0.9%
--- Walked: 1.8%
--- Bicycle: 0.4%
--- Taxicab, motorcycle, or other means: 1.5%
--- Worked from home: 9.8%
#40. Richland County (tie)
- Average commute to work: 22.8 minutes
- Share with commutes over an hour: 4.9%
- Share that worked outside their county of residence: 20.1%
- Means of transportation to work:
--- Drove alone: 74.8%
--- Carpooled: 7.8%
--- Public transportation: 1.1%
--- Walked: 7.4%
--- Bicycle: 0.1%
--- Taxicab, motorcycle, or other means: 1.8%
--- Worked from home: 7.1%
#39. Darlington County
- Average commute to work: 23.3 minutes
- Share with commutes over an hour: 5.4%
- Share that worked outside their county of residence: 42.4%
- Means of transportation to work:
--- Drove alone: 86.1%
--- Carpooled: 7.4%
--- Public transportation: 0.2%
--- Walked: 1.8%
--- Bicycle: 0.1%
--- Taxicab, motorcycle, or other means: 1.2%
--- Worked from home: 3.2%
#38. Greenville County
- Average commute to work: 23.6 minutes
- Share with commutes over an hour: 4%
- Share that worked outside their county of residence: 14.4%
- Means of transportation to work:
--- Drove alone: 78.8%
--- Carpooled: 8.4%
--- Public transportation: 0.3%
--- Walked: 1.4%
--- Bicycle: 0.2%
--- Taxicab, motorcycle, or other means: 1.9%
--- Worked from home: 9%
#37. Spartanburg County
- Average commute to work: 23.7 minutes
- Share with commutes over an hour: 4.6%
- Share that worked outside their county of residence: 19.2%
- Means of transportation to work:
--- Drove alone: 82.5%
--- Carpooled: 9.6%
--- Public transportation: 0.2%
--- Walked: 1%
--- Bicycle: 0%
--- Taxicab, motorcycle, or other means: 1%
--- Worked from home: 5.7%
#36. Charleston County
- Average commute to work: 24.3 minutes
- Share with commutes over an hour: 4.3%
- Share that worked outside their county of residence: 9.8%
- Means of transportation to work:
--- Drove alone: 76.5%
--- Carpooled: 7.5%
--- Public transportation: 1.1%
--- Walked: 2.2%
--- Bicycle: 0.8%
--- Taxicab, motorcycle, or other means: 1.2%
--- Worked from home: 10.8%
#35. Aiken County
- Average commute to work: 24.6 minutes
- Share with commutes over an hour: 4.8%
- Share that worked outside their county of residence: 9.7%
- Means of transportation to work:
--- Drove alone: 82.8%
--- Carpooled: 9.2%
--- Public transportation: 0.1%
--- Walked: 0.8%
--- Bicycle: 0%
--- Taxicab, motorcycle, or other means: 0.6%
--- Worked from home: 6.4%
#34. Oconee County
- Average commute to work: 24.8 minutes
- Share with commutes over an hour: 6.7%
- Share that worked outside their county of residence: 27.2%
- Means of transportation to work:
--- Drove alone: 80.3%
--- Carpooled: 11.1%
--- Public transportation: 0.3%
--- Walked: 0.8%
--- Bicycle: 0%
--- Taxicab, motorcycle, or other means: 0.7%
--- Worked from home: 6.7%
#33. Newberry County
- Average commute to work: 24.9 minutes
- Share with commutes over an hour: 7.2%
- Share that worked outside their county of residence: 32.6%
- Means of transportation to work:
--- Drove alone: 86.7%
--- Carpooled: 7.2%
--- Public transportation: 0%
--- Walked: 1.6%
--- Bicycle: 0.3%
--- Taxicab, motorcycle, or other means: 1.1%
--- Worked from home: 3.1%
#31. Anderson County (tie)
- Average commute to work: 25.1 minutes
- Share with commutes over an hour: 4.9%
- Share that worked outside their county of residence: 32.6%
- Means of transportation to work:
--- Drove alone: 83.9%
--- Carpooled: 9.6%
--- Public transportation: 0.3%
--- Walked: 1.1%
--- Bicycle: 0.1%
--- Taxicab, motorcycle, or other means: 0.8%
--- Worked from home: 4.3%
#31. Chesterfield County (tie)
- Average commute to work: 25.1 minutes
- Share with commutes over an hour: 7%
- Share that worked outside their county of residence: 20.5%
- Means of transportation to work:
--- Drove alone: 86.9%
--- Carpooled: 6.5%
--- Public transportation: 0.2%
--- Walked: 1%
--- Bicycle: 0.6%
--- Taxicab, motorcycle, or other means: 4.1%
--- Worked from home: 0.7%
#30. Cherokee County
- Average commute to work: 25.4 minutes
- Share with commutes over an hour: 6.9%
- Share that worked outside their county of residence: 30%
- Means of transportation to work:
--- Drove alone: 83%
--- Carpooled: 11.2%
--- Public transportation: 0%
--- Walked: 0.7%
--- Bicycle: 0%
--- Taxicab, motorcycle, or other means: 0.8%
--- Worked from home: 4.3%
#29. Lexington County
- Average commute to work: 26 minutes
- Share with commutes over an hour: 5.5%
- Share that worked outside their county of residence: 36.9%
- Means of transportation to work:
--- Drove alone: 82.1%
--- Carpooled: 8.7%
--- Public transportation: 0.1%
--- Walked: 0.8%
--- Bicycle: 0%
--- Taxicab, motorcycle, or other means: 1.1%
--- Worked from home: 7.2%
#27. Laurens County (tie)
- Average commute to work: 26.4 minutes
- Share with commutes over an hour: 8.4%
- Share that worked outside their county of residence: 43.3%
- Means of transportation to work:
--- Drove alone: 80.4%
--- Carpooled: 11.7%
--- Public transportation: 0%
--- Walked: 1.8%
--- Bicycle: 0%
--- Taxicab, motorcycle, or other means: 1.1%
--- Worked from home: 4.9%
#27. Pickens County (tie)
- Average commute to work: 26.4 minutes
- Share with commutes over an hour: 5.5%
- Share that worked outside their county of residence: 43.1%
- Means of transportation to work:
--- Drove alone: 79.1%
--- Carpooled: 9.3%
--- Public transportation: 1%
--- Walked: 2.1%
--- Bicycle: 0.3%
--- Taxicab, motorcycle, or other means: 0.8%
--- Worked from home: 7.5%
#26. Marlboro County
- Average commute to work: 26.6 minutes
- Share with commutes over an hour: 7.7%
- Share that worked outside their county of residence: 27.5%
- Means of transportation to work:
--- Drove alone: 87.3%
--- Carpooled: 8.5%
--- Public transportation: 0.2%
--- Walked: 0.5%
--- Bicycle: 0.2%
--- Taxicab, motorcycle, or other means: 1%
--- Worked from home: 2.3%
#25. Union County
- Average commute to work: 26.7 minutes
- Share with commutes over an hour: 8.9%
- Share that worked outside their county of residence: 41.3%
- Means of transportation to work:
--- Drove alone: 84.1%
--- Carpooled: 11.1%
--- Public transportation: 0.1%
--- Walked: 1.1%
--- Bicycle: 0.1%
--- Taxicab, motorcycle, or other means: 1.4%
--- Worked from home: 2%
#24. York County
- Average commute to work: 27.6 minutes
- Share with commutes over an hour: 8.4%
- Share that worked outside their county of residence: 5.5%
- Means of transportation to work:
--- Drove alone: 77.8%
--- Carpooled: 8.3%
--- Public transportation: 0.4%
--- Walked: 1.4%
--- Bicycle: 0.1%
--- Taxicab, motorcycle, or other means: 0.9%
--- Worked from home: 11.1%
#23. Edgefield County
- Average commute to work: 27.9 minutes
- Share with commutes over an hour: 10%
- Share that worked outside their county of residence: 37.8%
- Means of transportation to work:
--- Drove alone: 81.1%
--- Carpooled: 10.5%
--- Public transportation: 0.2%
--- Walked: 1.9%
--- Bicycle: 0%
--- Taxicab, motorcycle, or other means: 1%
--- Worked from home: 5.2%
#22. Jasper County
- Average commute to work: 28 minutes
- Share with commutes over an hour: 8.3%
- Share that worked outside their county of residence: 50%
- Means of transportation to work:
--- Drove alone: 85.6%
--- Carpooled: 10.5%
--- Public transportation: 0%
--- Walked: 1.2%
--- Bicycle: 0%
--- Taxicab, motorcycle, or other means: 0.6%
--- Worked from home: 2.1%
#21. Berkeley County
- Average commute to work: 28.2 minutes
- Share with commutes over an hour: 7.7%
- Share that worked outside their county of residence: 53%
- Means of transportation to work:
--- Drove alone: 80.9%
--- Carpooled: 8.1%
--- Public transportation: 0.5%
--- Walked: 1.9%
--- Bicycle: 0.3%
--- Taxicab, motorcycle, or other means: 0.9%
--- Worked from home: 7.5%
#19. Kershaw County (tie)
- Average commute to work: 28.4 minutes
- Share with commutes over an hour: 6.7%
- Share that worked outside their county of residence: 48.6%
- Means of transportation to work:
--- Drove alone: 83.9%
--- Carpooled: 8.7%
--- Public transportation: 0.1%
--- Walked: 0.6%
--- Bicycle: 0.1%
--- Taxicab, motorcycle, or other means: 1.5%
--- Worked from home: 5.1%
#19. Lee County (tie)
- Average commute to work: 28.4 minutes
- Share with commutes over an hour: 8.1%
- Share that worked outside their county of residence: 59.6%
- Means of transportation to work:
--- Drove alone: 87.7%
--- Carpooled: 8.5%
--- Public transportation: 0.5%
--- Walked: 0.9%
--- Bicycle: 0%
--- Taxicab, motorcycle, or other means: 0.4%
--- Worked from home: 2%
#18. Calhoun County
- Average commute to work: 28.5 minutes
- Share with commutes over an hour: 3.6%
- Share that worked outside their county of residence: 65.5%
- Means of transportation to work:
--- Drove alone: 89.9%
--- Carpooled: 5.3%
--- Public transportation: 0%
--- Walked: 1.5%
--- Bicycle: 0%
--- Taxicab, motorcycle, or other means: 0.5%
--- Worked from home: 2.9%
#17. Georgetown County
- Average commute to work: 28.9 minutes
- Share with commutes over an hour: 12.9%
- Share that worked outside their county of residence: 29.7%
- Means of transportation to work:
--- Drove alone: 79.1%
--- Carpooled: 9.3%
--- Public transportation: 0.8%
--- Walked: 1.5%
--- Bicycle: 0.1%
--- Taxicab, motorcycle, or other means: 1.3%
--- Worked from home: 8%
#16. Abbeville County
- Average commute to work: 29 minutes
- Share with commutes over an hour: 8.5%
- Share that worked outside their county of residence: 56.8%
- Means of transportation to work:
--- Drove alone: 82%
--- Carpooled: 10.8%
--- Public transportation: 0.2%
--- Walked: 2.9%
--- Bicycle: 0%
--- Taxicab, motorcycle, or other means: 1.1%
--- Worked from home: 3%
#15. Bamberg County
- Average commute to work: 29.4 minutes
- Share with commutes over an hour: 15.5%
- Share that worked outside their county of residence: 44.8%
- Means of transportation to work:
--- Drove alone: 83.3%
--- Carpooled: 5.2%
--- Public transportation: 2.7%
--- Walked: 3.3%
--- Bicycle: 0%
--- Taxicab, motorcycle, or other means: 1.6%
--- Worked from home: 3.9%
#14. Orangeburg County
- Average commute to work: 29.6 minutes
- Share with commutes over an hour: 13.9%
- Share that worked outside their county of residence: 29.4%
- Means of transportation to work:
--- Drove alone: 85.5%
--- Carpooled: 7.7%
--- Public transportation: 0.1%
--- Walked: 1.2%
--- Bicycle: 0.1%
--- Taxicab, motorcycle, or other means: 0.8%
--- Worked from home: 4.6%
#12. Clarendon County (tie)
- Average commute to work: 29.8 minutes
- Share with commutes over an hour: 13.7%
- Share that worked outside their county of residence: 46.2%
- Means of transportation to work:
--- Drove alone: 83.3%
--- Carpooled: 9.2%
--- Public transportation: 0.2%
--- Walked: 1.6%
--- Bicycle: 0.2%
--- Taxicab, motorcycle, or other means: 1.2%
--- Worked from home: 4.3%
#12. Fairfield County (tie)
- Average commute to work: 29.8 minutes
- Share with commutes over an hour: 6.1%
- Share that worked outside their county of residence: 56%
- Means of transportation to work:
--- Drove alone: 89.4%
--- Carpooled: 4.3%
--- Public transportation: 1.2%
--- Walked: 0.5%
--- Bicycle: 0%
--- Taxicab, motorcycle, or other means: 1%
--- Worked from home: 3.4%
#11. Chester County
- Average commute to work: 30.2 minutes
- Share with commutes over an hour: 9.8%
- Share that worked outside their county of residence: 45.8%
- Means of transportation to work:
--- Drove alone: 84.7%
--- Carpooled: 9.8%
--- Public transportation: 0.2%
--- Walked: 1%
--- Bicycle: 0%
--- Taxicab, motorcycle, or other means: 0.8%
--- Worked from home: 3.4%
#10. Marion County
- Average commute to work: 30.6 minutes
- Share with commutes over an hour: 13%
- Share that worked outside their county of residence: 46.4%
- Means of transportation to work:
--- Drove alone: 87.8%
--- Carpooled: 8.3%
--- Public transportation: 1%
--- Walked: 0.3%
--- Bicycle: 0%
--- Taxicab, motorcycle, or other means: 0.9%
--- Worked from home: 1.6%
#9. Lancaster County
- Average commute to work: 30.7 minutes
- Share with commutes over an hour: 12.2%
- Share that worked outside their county of residence: 20.9%
- Means of transportation to work:
--- Drove alone: 78.4%
--- Carpooled: 8.1%
--- Public transportation: 0.3%
--- Walked: 0.6%
--- Bicycle: 0%
--- Taxicab, motorcycle, or other means: 1.5%
--- Worked from home: 11.1%
#8. Dorchester County
- Average commute to work: 30.8 minutes
- Share with commutes over an hour: 11%
- Share that worked outside their county of residence: 59.3%
- Means of transportation to work:
--- Drove alone: 83.6%
--- Carpooled: 7.1%
--- Public transportation: 0.1%
--- Walked: 0.6%
--- Bicycle: 0.3%
--- Taxicab, motorcycle, or other means: 1.5%
--- Worked from home: 6.7%
#7. Barnwell County
- Average commute to work: 31.7 minutes
- Share with commutes over an hour: 15.6%
- Share that worked outside their county of residence: 41.5%
- Means of transportation to work:
--- Drove alone: 85.5%
--- Carpooled: 8.2%
--- Public transportation: 2.4%
--- Walked: 1.2%
--- Bicycle: 0%
--- Taxicab, motorcycle, or other means: 0.9%
--- Worked from home: 1.7%
#6. Hampton County
- Average commute to work: 31.8 minutes
- Share with commutes over an hour: 16.2%
- Share that worked outside their county of residence: 41.1%
- Means of transportation to work:
--- Drove alone: 82.2%
--- Carpooled: 13.8%
--- Public transportation: 0.7%
--- Walked: 0.6%
--- Bicycle: 0%
--- Taxicab, motorcycle, or other means: 0.9%
--- Worked from home: 1.7%
#5. Williamsburg County
- Average commute to work: 32 minutes
- Share with commutes over an hour: 21%
- Share that worked outside their county of residence: 45.1%
- Means of transportation to work:
--- Drove alone: 85.1%
--- Carpooled: 7.3%
--- Public transportation: 1.3%
--- Walked: 0.8%
--- Bicycle: 0%
--- Taxicab, motorcycle, or other means: 1.3%
--- Worked from home: 4.2%
#4. Colleton County
- Average commute to work: 32.2 minutes
- Share with commutes over an hour: 15.9%
- Share that worked outside their county of residence: 29.8%
- Means of transportation to work:
--- Drove alone: 80.3%
--- Carpooled: 14.2%
--- Public transportation: 0%
--- Walked: 0.8%
--- Bicycle: 0.1%
--- Taxicab, motorcycle, or other means: 1.7%
--- Worked from home: 2.8%
#3. Allendale County
- Average commute to work: 32.9 minutes
- Share with commutes over an hour: 22.8%
- Share that worked outside their county of residence: 53.7%
- Means of transportation to work:
--- Drove alone: 81.8%
--- Carpooled: 10.2%
--- Public transportation: 1.3%
--- Walked: 3.6%
--- Bicycle: 0%
--- Taxicab, motorcycle, or other means: 2.8%
--- Worked from home: 0.3%
#2. Saluda County
- Average commute to work: 33.3 minutes
- Share with commutes over an hour: 14.7%
- Share that worked outside their county of residence: 58.7%
- Means of transportation to work:
--- Drove alone: 78.9%
--- Carpooled: 12.2%
--- Public transportation: 0%
--- Walked: 1.4%
--- Bicycle: 0%
--- Taxicab, motorcycle, or other means: 4.6%
--- Worked from home: 2.8%
#1. McCormick County
- Average commute to work: 34.3 minutes
- Share with commutes over an hour: 11%
- Share that worked outside their county of residence: 38.8%
- Means of transportation to work:
--- Drove alone: 89.6%
--- Carpooled: 5.8%
--- Public transportation: 0.1%
--- Walked: 1.3%
--- Bicycle: 0%
--- Taxicab, motorcycle, or other means: 0.3%
--- Worked from home: 2.9%


