Counties with the worst commutes in Wisconsin
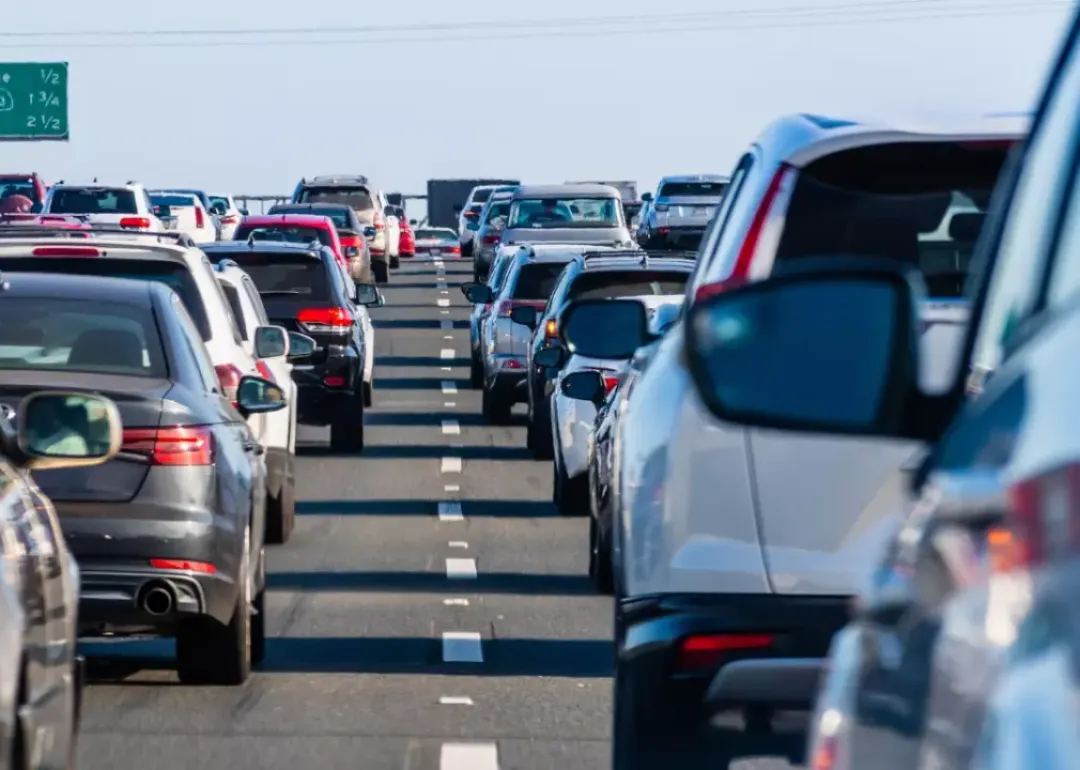
Commuting easily ranks as one of the least enjoyable parts of a person's day. Commuters encounter more physical health problems, and low-income commuters are less likely to gain financial stability—among a host of other negative impacts. And yet, America's commutes keep getting longer as people move farther away from the office, according to Census Bureau data.
Stacker compiled a list of counties with the worst commutes in Wisconsin, using 2021 data from the Census Bureau. Counties are ranked by longest average commute time in 2021 among workers over the age of 16, excluding those who work from home. Think you have a long trip to work? Read on to compare it against the worst commutes statewide.
#49. Menominee County (tie)
- Average commute to work: 21.8 minutes
- Share with commutes over an hour: 6%
- Share that worked outside their county of residence: 20.6%
- Means of transportation to work:
--- Drove alone: 78.2%
--- Carpooled: 8.7%
--- Public transportation: 1.3%
--- Walked: 3.8%
--- Bicycle: 0%
--- Taxicab, motorcycle, or other means: 1.1%
--- Worked from home: 7%
#49. Oneida County (tie)
- Average commute to work: 21.8 minutes
- Share with commutes over an hour: 6.1%
- Share that worked outside their county of residence: 19%
- Means of transportation to work:
--- Drove alone: 80.2%
--- Carpooled: 8.2%
--- Public transportation: 0.2%
--- Walked: 2.8%
--- Bicycle: 0.3%
--- Taxicab, motorcycle, or other means: 1.2%
--- Worked from home: 7%
#48. Langlade County
- Average commute to work: 22.1 minutes
- Share with commutes over an hour: 7.4%
- Share that worked outside their county of residence: 21.8%
- Means of transportation to work:
--- Drove alone: 82.4%
--- Carpooled: 6.2%
--- Public transportation: 0.2%
--- Walked: 4.7%
--- Bicycle: 0%
--- Taxicab, motorcycle, or other means: 0.5%
--- Worked from home: 6.1%
#46. Douglas County (tie)
- Average commute to work: 22.2 minutes
- Share with commutes over an hour: 4.8%
- Share that worked outside their county of residence: 3%
- Means of transportation to work:
--- Drove alone: 76.6%
--- Carpooled: 10.6%
--- Public transportation: 1%
--- Walked: 4.8%
--- Bicycle: 0%
--- Taxicab, motorcycle, or other means: 1%
--- Worked from home: 6%
#46. Sauk County (tie)
- Average commute to work: 22.2 minutes
- Share with commutes over an hour: 6.4%
- Share that worked outside their county of residence: 24.9%
- Means of transportation to work:
--- Drove alone: 80.5%
--- Carpooled: 8.7%
--- Public transportation: 0.2%
--- Walked: 2.8%
--- Bicycle: 0.3%
--- Taxicab, motorcycle, or other means: 1.2%
--- Worked from home: 6.3%
#45. Milwaukee County
- Average commute to work: 22.3 minutes
- Share with commutes over an hour: 3.8%
- Share that worked outside their county of residence: 20.1%
- Means of transportation to work:
--- Drove alone: 74.5%
--- Carpooled: 8.2%
--- Public transportation: 4.1%
--- Walked: 3.1%
--- Bicycle: 0.5%
--- Taxicab, motorcycle, or other means: 0.9%
--- Worked from home: 8.8%
#44. Chippewa County
- Average commute to work: 22.5 minutes
- Share with commutes over an hour: 4.9%
- Share that worked outside their county of residence: 36.4%
- Means of transportation to work:
--- Drove alone: 79.9%
--- Carpooled: 7.7%
--- Public transportation: 0%
--- Walked: 2.1%
--- Bicycle: 0.6%
--- Taxicab, motorcycle, or other means: 1.2%
--- Worked from home: 8.6%
#43. Calumet County
- Average commute to work: 22.6 minutes
- Share with commutes over an hour: 4.1%
- Share that worked outside their county of residence: 65.4%
- Means of transportation to work:
--- Drove alone: 83.3%
--- Carpooled: 6.2%
--- Public transportation: 0.2%
--- Walked: 1.6%
--- Bicycle: 0.2%
--- Taxicab, motorcycle, or other means: 0.9%
--- Worked from home: 7.6%
#42. Dunn County
- Average commute to work: 22.7 minutes
- Share with commutes over an hour: 7.1%
- Share that worked outside their county of residence: 31.1%
- Means of transportation to work:
--- Drove alone: 77.9%
--- Carpooled: 6.3%
--- Public transportation: 0.2%
--- Walked: 6.3%
--- Bicycle: 1%
--- Taxicab, motorcycle, or other means: 0.6%
--- Worked from home: 7.6%
#40. Lincoln County (tie)
- Average commute to work: 22.8 minutes
- Share with commutes over an hour: 5.7%
- Share that worked outside their county of residence: 32.5%
- Means of transportation to work:
--- Drove alone: 83.9%
--- Carpooled: 5.2%
--- Public transportation: 0.3%
--- Walked: 2%
--- Bicycle: 0.1%
--- Taxicab, motorcycle, or other means: 1%
--- Worked from home: 7.4%
#40. Trempealeau County (tie)
- Average commute to work: 22.8 minutes
- Share with commutes over an hour: 4.5%
- Share that worked outside their county of residence: 26.7%
- Means of transportation to work:
--- Drove alone: 79.3%
--- Carpooled: 7.7%
--- Public transportation: 0.1%
--- Walked: 3.1%
--- Bicycle: 0.1%
--- Taxicab, motorcycle, or other means: 0.8%
--- Worked from home: 8.8%
#37. Clark County (tie)
- Average commute to work: 23 minutes
- Share with commutes over an hour: 6.5%
- Share that worked outside their county of residence: 36.1%
- Means of transportation to work:
--- Drove alone: 71.5%
--- Carpooled: 9.5%
--- Public transportation: 0%
--- Walked: 4.9%
--- Bicycle: 1.9%
--- Taxicab, motorcycle, or other means: 1.2%
--- Worked from home: 11%
#37. Crawford County (tie)
- Average commute to work: 23 minutes
- Share with commutes over an hour: 9.5%
- Share that worked outside their county of residence: 24.8%
- Means of transportation to work:
--- Drove alone: 75.7%
--- Carpooled: 14.2%
--- Public transportation: 0.9%
--- Walked: 3.2%
--- Bicycle: 0.2%
--- Taxicab, motorcycle, or other means: 1.3%
--- Worked from home: 4.6%
#37. Rock County (tie)
- Average commute to work: 23 minutes
- Share with commutes over an hour: 5.2%
- Share that worked outside their county of residence: 23.1%
- Means of transportation to work:
--- Drove alone: 82.7%
--- Carpooled: 8.4%
--- Public transportation: 0.6%
--- Walked: 1.6%
--- Bicycle: 0.3%
--- Taxicab, motorcycle, or other means: 1%
--- Worked from home: 5.5%
#36. Florence County
- Average commute to work: 23.2 minutes
- Share with commutes over an hour: 5.7%
- Share that worked outside their county of residence: 15.8%
- Means of transportation to work:
--- Drove alone: 83.7%
--- Carpooled: 6.5%
--- Public transportation: 0.2%
--- Walked: 1.8%
--- Bicycle: 0%
--- Taxicab, motorcycle, or other means: 0%
--- Worked from home: 7.7%
#33. Bayfield County (tie)
- Average commute to work: 23.3 minutes
- Share with commutes over an hour: 8.1%
- Share that worked outside their county of residence: 36.2%
- Means of transportation to work:
--- Drove alone: 73.8%
--- Carpooled: 9.7%
--- Public transportation: 2.4%
--- Walked: 3%
--- Bicycle: 0.3%
--- Taxicab, motorcycle, or other means: 0.8%
--- Worked from home: 10%
#33. Ozaukee County (tie)
- Average commute to work: 23.3 minutes
- Share with commutes over an hour: 3.5%
- Share that worked outside their county of residence: 42.4%
- Means of transportation to work:
--- Drove alone: 80.5%
--- Carpooled: 5.5%
--- Public transportation: 0.5%
--- Walked: 1.4%
--- Bicycle: 0.3%
--- Taxicab, motorcycle, or other means: 0.8%
--- Worked from home: 11%
#33. Shawano County (tie)
- Average commute to work: 23.3 minutes
- Share with commutes over an hour: 6.1%
- Share that worked outside their county of residence: 40%
- Means of transportation to work:
--- Drove alone: 81%
--- Carpooled: 5.5%
--- Public transportation: 0.1%
--- Walked: 3%
--- Bicycle: 0.4%
--- Taxicab, motorcycle, or other means: 1.7%
--- Worked from home: 8.4%
#31. Forest County (tie)
- Average commute to work: 23.4 minutes
- Share with commutes over an hour: 8.6%
- Share that worked outside their county of residence: 23.8%
- Means of transportation to work:
--- Drove alone: 78.8%
--- Carpooled: 10%
--- Public transportation: 0.5%
--- Walked: 3.1%
--- Bicycle: 0.3%
--- Taxicab, motorcycle, or other means: 0.5%
--- Worked from home: 6.7%
#31. Waukesha County (tie)
- Average commute to work: 23.4 minutes
- Share with commutes over an hour: 4.1%
- Share that worked outside their county of residence: 31.5%
- Means of transportation to work:
--- Drove alone: 80.8%
--- Carpooled: 5.6%
--- Public transportation: 0.4%
--- Walked: 1.2%
--- Bicycle: 0.2%
--- Taxicab, motorcycle, or other means: 0.8%
--- Worked from home: 11.1%
#29. Dodge County (tie)
- Average commute to work: 23.5 minutes
- Share with commutes over an hour: 7.2%
- Share that worked outside their county of residence: 44.2%
- Means of transportation to work:
--- Drove alone: 82.1%
--- Carpooled: 7.9%
--- Public transportation: 0.1%
--- Walked: 3.6%
--- Bicycle: 0.1%
--- Taxicab, motorcycle, or other means: 0.7%
--- Worked from home: 5.4%
#29. Kewaunee County (tie)
- Average commute to work: 23.5 minutes
- Share with commutes over an hour: 4.1%
- Share that worked outside their county of residence: 48.5%
- Means of transportation to work:
--- Drove alone: 79.6%
--- Carpooled: 8.3%
--- Public transportation: 0.2%
--- Walked: 2.8%
--- Bicycle: 0.1%
--- Taxicab, motorcycle, or other means: 0.5%
--- Worked from home: 8.6%
#28. Taylor County
- Average commute to work: 23.7 minutes
- Share with commutes over an hour: 8.1%
- Share that worked outside their county of residence: 26.1%
- Means of transportation to work:
--- Drove alone: 75.4%
--- Carpooled: 8.8%
--- Public transportation: 0.3%
--- Walked: 3.4%
--- Bicycle: 0%
--- Taxicab, motorcycle, or other means: 1.5%
--- Worked from home: 10.6%
#25. Jackson County (tie)
- Average commute to work: 24 minutes
- Share with commutes over an hour: 5.9%
- Share that worked outside their county of residence: 31.2%
- Means of transportation to work:
--- Drove alone: 77.1%
--- Carpooled: 10%
--- Public transportation: 0.1%
--- Walked: 4%
--- Bicycle: 0.1%
--- Taxicab, motorcycle, or other means: 1.4%
--- Worked from home: 7.4%
#25. Juneau County (tie)
- Average commute to work: 24 minutes
- Share with commutes over an hour: 7.3%
- Share that worked outside their county of residence: 38.8%
- Means of transportation to work:
--- Drove alone: 81.7%
--- Carpooled: 7.3%
--- Public transportation: 0.1%
--- Walked: 3.7%
--- Bicycle: 0.2%
--- Taxicab, motorcycle, or other means: 1.7%
--- Worked from home: 5.4%
#25. Racine County (tie)
- Average commute to work: 24 minutes
- Share with commutes over an hour: 5.1%
- Share that worked outside their county of residence: 34.9%
- Means of transportation to work:
--- Drove alone: 82.3%
--- Carpooled: 6.9%
--- Public transportation: 1.1%
--- Walked: 0.9%
--- Bicycle: 0.2%
--- Taxicab, motorcycle, or other means: 2%
--- Worked from home: 6.5%
#24. Washburn County
- Average commute to work: 24.3 minutes
- Share with commutes over an hour: 6.9%
- Share that worked outside their county of residence: 29.3%
- Means of transportation to work:
--- Drove alone: 77.5%
--- Carpooled: 8.9%
--- Public transportation: 0.1%
--- Walked: 2.4%
--- Bicycle: 0%
--- Taxicab, motorcycle, or other means: 1%
--- Worked from home: 10%
#22. Green County (tie)
- Average commute to work: 24.6 minutes
- Share with commutes over an hour: 7.6%
- Share that worked outside their county of residence: 36.3%
- Means of transportation to work:
--- Drove alone: 81.2%
--- Carpooled: 6.4%
--- Public transportation: 0%
--- Walked: 2.9%
--- Bicycle: 0.1%
--- Taxicab, motorcycle, or other means: 0.6%
--- Worked from home: 8.7%
#22. Waupaca County (tie)
- Average commute to work: 24.6 minutes
- Share with commutes over an hour: 7%
- Share that worked outside their county of residence: 35.8%
- Means of transportation to work:
--- Drove alone: 82.7%
--- Carpooled: 6.2%
--- Public transportation: 0.1%
--- Walked: 3.5%
--- Bicycle: 0.4%
--- Taxicab, motorcycle, or other means: 1.1%
--- Worked from home: 6%
#20. Vernon County (tie)
- Average commute to work: 24.7 minutes
- Share with commutes over an hour: 6.3%
- Share that worked outside their county of residence: 39.8%
- Means of transportation to work:
--- Drove alone: 76.7%
--- Carpooled: 7.5%
--- Public transportation: 0.5%
--- Walked: 3.4%
--- Bicycle: 0.4%
--- Taxicab, motorcycle, or other means: 2.3%
--- Worked from home: 9.2%
#20. Walworth County (tie)
- Average commute to work: 24.7 minutes
- Share with commutes over an hour: 8.3%
- Share that worked outside their county of residence: 26.7%
- Means of transportation to work:
--- Drove alone: 79.5%
--- Carpooled: 7.8%
--- Public transportation: 0.4%
--- Walked: 3.5%
--- Bicycle: 0.4%
--- Taxicab, motorcycle, or other means: 0.7%
--- Worked from home: 7.8%
#19. Green Lake County
- Average commute to work: 24.8 minutes
- Share with commutes over an hour: 7.4%
- Share that worked outside their county of residence: 47.1%
- Means of transportation to work:
--- Drove alone: 78%
--- Carpooled: 8.6%
--- Public transportation: 0.2%
--- Walked: 3.5%
--- Bicycle: 0.2%
--- Taxicab, motorcycle, or other means: 1.2%
--- Worked from home: 8.4%
#18. Iowa County
- Average commute to work: 24.9 minutes
- Share with commutes over an hour: 7.2%
- Share that worked outside their county of residence: 37.4%
- Means of transportation to work:
--- Drove alone: 78%
--- Carpooled: 6.8%
--- Public transportation: 0.2%
--- Walked: 3.1%
--- Bicycle: 0.2%
--- Taxicab, motorcycle, or other means: 0.8%
--- Worked from home: 10.9%
#16. Buffalo County (tie)
- Average commute to work: 25 minutes
- Share with commutes over an hour: 5.6%
- Share that worked outside their county of residence: 33.2%
- Means of transportation to work:
--- Drove alone: 78.4%
--- Carpooled: 7.6%
--- Public transportation: 0.1%
--- Walked: 4.7%
--- Bicycle: 0.2%
--- Taxicab, motorcycle, or other means: 1.2%
--- Worked from home: 7.8%
#16. Richland County (tie)
- Average commute to work: 25 minutes
- Share with commutes over an hour: 9.6%
- Share that worked outside their county of residence: 35.6%
- Means of transportation to work:
--- Drove alone: 79.7%
--- Carpooled: 8.3%
--- Public transportation: 0.6%
--- Walked: 2.9%
--- Bicycle: 0.4%
--- Taxicab, motorcycle, or other means: 0.8%
--- Worked from home: 7.3%
#15. Lafayette County
- Average commute to work: 25.1 minutes
- Share with commutes over an hour: 8%
- Share that worked outside their county of residence: 40.1%
- Means of transportation to work:
--- Drove alone: 77.9%
--- Carpooled: 6.2%
--- Public transportation: 0.1%
--- Walked: 3.5%
--- Bicycle: 0%
--- Taxicab, motorcycle, or other means: 1.2%
--- Worked from home: 11.1%
#14. Washington County
- Average commute to work: 25.2 minutes
- Share with commutes over an hour: 4.2%
- Share that worked outside their county of residence: 46.5%
- Means of transportation to work:
--- Drove alone: 82.7%
--- Carpooled: 6.3%
--- Public transportation: 0.2%
--- Walked: 1.4%
--- Bicycle: 0.3%
--- Taxicab, motorcycle, or other means: 0.7%
--- Worked from home: 8.5%
#13. Jefferson County
- Average commute to work: 25.3 minutes
- Share with commutes over an hour: 7.5%
- Share that worked outside their county of residence: 45%
- Means of transportation to work:
--- Drove alone: 81.1%
--- Carpooled: 7.6%
--- Public transportation: 0.3%
--- Walked: 3.7%
--- Bicycle: 0.2%
--- Taxicab, motorcycle, or other means: 0.9%
--- Worked from home: 6.3%
#12. Rusk County
- Average commute to work: 25.7 minutes
- Share with commutes over an hour: 10.6%
- Share that worked outside their county of residence: 24.9%
- Means of transportation to work:
--- Drove alone: 80%
--- Carpooled: 7.3%
--- Public transportation: 0.3%
--- Walked: 3.1%
--- Bicycle: 0.1%
--- Taxicab, motorcycle, or other means: 0.8%
--- Worked from home: 8.5%
#11. Kenosha County
- Average commute to work: 26.2 minutes
- Share with commutes over an hour: 8.4%
- Share that worked outside their county of residence: 18.5%
- Means of transportation to work:
--- Drove alone: 82.3%
--- Carpooled: 7.7%
--- Public transportation: 1.2%
--- Walked: 1.4%
--- Bicycle: 0.3%
--- Taxicab, motorcycle, or other means: 1.1%
--- Worked from home: 6.1%
#10. St. Croix County
- Average commute to work: 26.3 minutes
- Share with commutes over an hour: 7.2%
- Share that worked outside their county of residence: 7.3%
- Means of transportation to work:
--- Drove alone: 79.6%
--- Carpooled: 7.9%
--- Public transportation: 0.3%
--- Walked: 1.3%
--- Bicycle: 0.2%
--- Taxicab, motorcycle, or other means: 1%
--- Worked from home: 9.7%
#9. Pepin County
- Average commute to work: 26.5 minutes
- Share with commutes over an hour: 9.3%
- Share that worked outside their county of residence: 36.4%
- Means of transportation to work:
--- Drove alone: 77.8%
--- Carpooled: 6.5%
--- Public transportation: 0%
--- Walked: 2.6%
--- Bicycle: 0.1%
--- Taxicab, motorcycle, or other means: 0.8%
--- Worked from home: 12.2%
#8. Columbia County
- Average commute to work: 26.7 minutes
- Share with commutes over an hour: 6.3%
- Share that worked outside their county of residence: 50.6%
- Means of transportation to work:
--- Drove alone: 80.7%
--- Carpooled: 8.2%
--- Public transportation: 0.2%
--- Walked: 2.2%
--- Bicycle: 0.1%
--- Taxicab, motorcycle, or other means: 0.8%
--- Worked from home: 7.8%
#7. Pierce County
- Average commute to work: 27 minutes
- Share with commutes over an hour: 8.8%
- Share that worked outside their county of residence: 22.1%
- Means of transportation to work:
--- Drove alone: 77.4%
--- Carpooled: 8%
--- Public transportation: 0.1%
--- Walked: 4.5%
--- Bicycle: 0.1%
--- Taxicab, motorcycle, or other means: 0.7%
--- Worked from home: 9.1%
#5. Oconto County (tie)
- Average commute to work: 27.2 minutes
- Share with commutes over an hour: 6.3%
- Share that worked outside their county of residence: 53.2%
- Means of transportation to work:
--- Drove alone: 80.9%
--- Carpooled: 7.7%
--- Public transportation: 0.1%
--- Walked: 2%
--- Bicycle: 0%
--- Taxicab, motorcycle, or other means: 1.1%
--- Worked from home: 8.2%
#5. Waushara County (tie)
- Average commute to work: 27.2 minutes
- Share with commutes over an hour: 8.5%
- Share that worked outside their county of residence: 49.5%
- Means of transportation to work:
--- Drove alone: 82.7%
--- Carpooled: 7.9%
--- Public transportation: 0.3%
--- Walked: 2.1%
--- Bicycle: 0.3%
--- Taxicab, motorcycle, or other means: 1.9%
--- Worked from home: 5%
#4. Adams County
- Average commute to work: 28.2 minutes
- Share with commutes over an hour: 11.2%
- Share that worked outside their county of residence: 53.4%
- Means of transportation to work:
--- Drove alone: 80.2%
--- Carpooled: 9.1%
--- Public transportation: 0.1%
--- Walked: 1.2%
--- Bicycle: 0.2%
--- Taxicab, motorcycle, or other means: 1.1%
--- Worked from home: 8.1%
#3. Polk County
- Average commute to work: 29.6 minutes
- Share with commutes over an hour: 14.2%
- Share that worked outside their county of residence: 18.5%
- Means of transportation to work:
--- Drove alone: 82.1%
--- Carpooled: 7.1%
--- Public transportation: 0.1%
--- Walked: 2%
--- Bicycle: 0.2%
--- Taxicab, motorcycle, or other means: 0.7%
--- Worked from home: 7.8%
#2. Marquette County
- Average commute to work: 30.4 minutes
- Share with commutes over an hour: 12.7%
- Share that worked outside their county of residence: 56.9%
- Means of transportation to work:
--- Drove alone: 82.3%
--- Carpooled: 8.2%
--- Public transportation: 0.1%
--- Walked: 2.5%
--- Bicycle: 0%
--- Taxicab, motorcycle, or other means: 1.1%
--- Worked from home: 5.8%
#1. Burnett County
- Average commute to work: 31.3 minutes
- Share with commutes over an hour: 16.9%
- Share that worked outside their county of residence: 20.9%
- Means of transportation to work:
--- Drove alone: 78.6%
--- Carpooled: 8.6%
--- Public transportation: 0.7%
--- Walked: 2.3%
--- Bicycle: 0.3%
--- Taxicab, motorcycle, or other means: 1.4%
--- Worked from home: 8.1%


