States with the most CO2 emissions
States with the most CO2 emissions
Although the United States has seen a 12% decrease in carbon dioxide emissions since 2005, according to EPA findings, the June 30, 2022, U.S. Supreme Court decision that hamstrings that agency from regulating carbon emissions effectively transferred the onus for the meaningful address of climate change onto the individual states.
Meanwhile, the carbon footprint of each respective state looks drastically different. While many states implemented solutions for decreasing total carbon emissions, other states have run into complications—particularly on the industrial level, as well as the use of transportation—that still require high usage of fossil fuels.
As energy consumption is a major factor in the production and release of CO2, Stacker cited 2019 data released in April 2022 from the U.S. Energy Information Administration to explore which states emit the most carbon dioxide from energy consumption. State-level figures are normalized on a per-capita basis.
A 2019 U.S. Energy Information Administration report found that from 2005-2016, 41 states successfully reduced their carbon emissions while emission levels rose in nine states. States with larger geographic areas, such as Texas and California, continued to lead the pack in terms of emission levels; in fact, Texas showed the highest overall emission increase during this period of any U.S. state. But there were also large states that lean heavily on automotive manufacturing and steel production that managed significant reductions. Case in point: Ohio dropped its emission level by 24% during the reporting period.
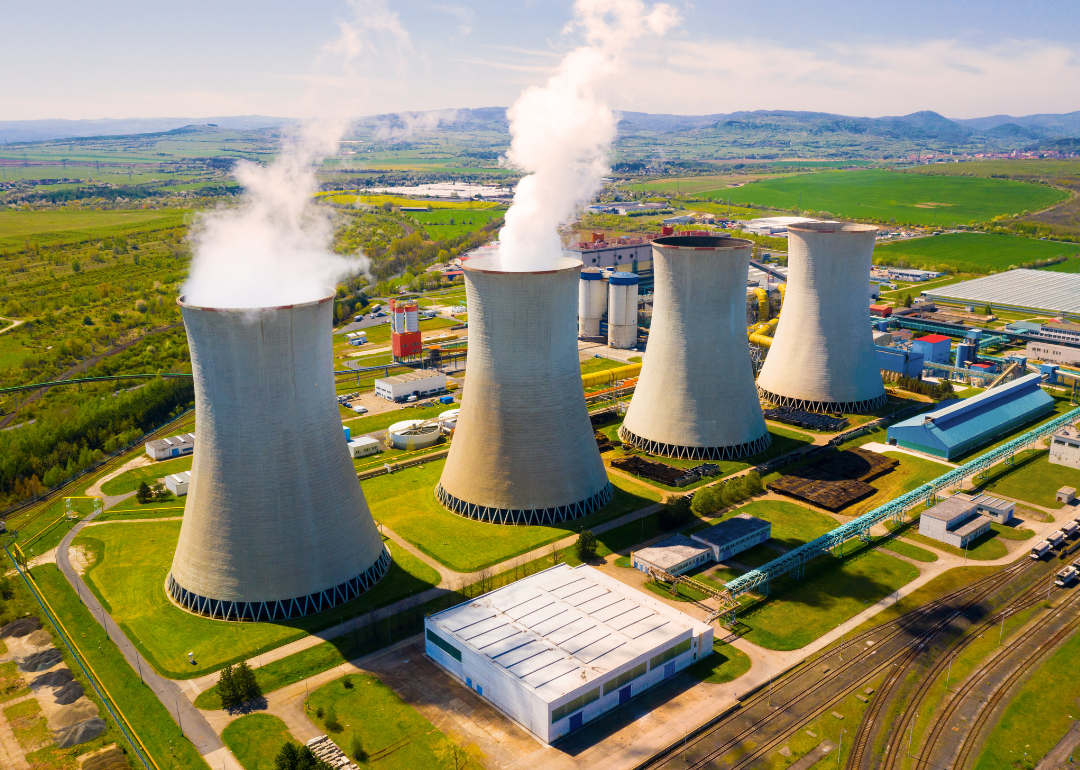
Carbon emissions refer to the production and release of greenhouse gas derived from burning fossil fuels such as coal, oil, and natural gas for various human activities, among them electricity generation, transportation, and heat production. The burning of solid waste, trees, and other biological materials can also result in a chemical reaction that releases carbon dioxide into the atmosphere. Greenhouse gas is primarily emitted in the form of carbon dioxide—79% of all emissions took this form as of 2020, according to the EPA—but methane, nitrous oxide, and fluorinated gas are also contributors.
The U.S. Geological Survey found nearly one-quarter of carbon dioxide emissions (23.7%) come from fossil fuels extracted on public lands as of a 2018 report that covered the period 2005-2014, while the NOAA has tracked a steady increase in atmospheric carbon dioxide since 1960, demonstrating that despite gains in carbon reduction in many areas of the country, levels generally continue to rise and along with them global atmospheric concentrations are causing increases in temperature.
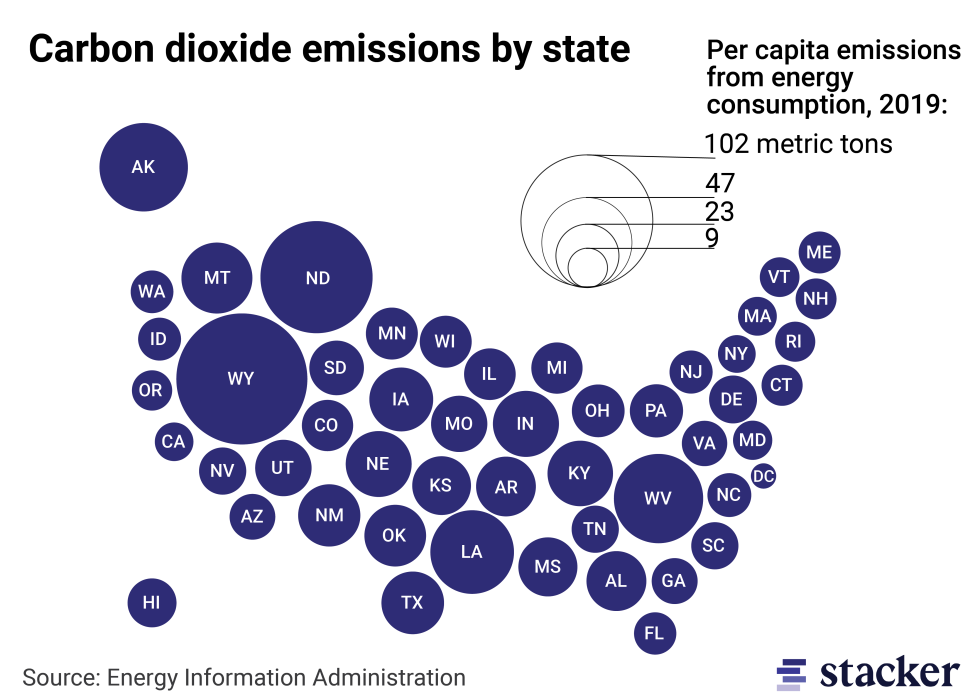
Wyoming emits the most per-capita carbon dioxide emissions overall
The USGS reported that 57% of all fossil fuels produced on federal lands occur in the state of Wyoming. This includes carbon emissions from energy consumption across electricity generation, residential energy consumption, commercial energy consumption, industrial emissions, and transportation emissions.
Wyoming released more than 59 million tons of carbon emissions in 2019—more than 39 million of it coming from coal. Wyoming produces nearly 40% of the nation's coal, according to the EIA—it has, in fact, been the nation’s top coal producer since 1986. Moreover, the state relies on fossil fuels for nearly 60% of state and local revenues.
A law was signed in Wyoming in 2020 requiring utilities to generate some of their power from coal plants outfitted with carbon capture equipment; however, a subsequent filing by utility company Rocky Mountain Power claimed that the retrofitting of coal plants for carbon capture would be economically unfeasible and force the company to pass the hundreds of millions of dollars in resulting cost on to it customers.
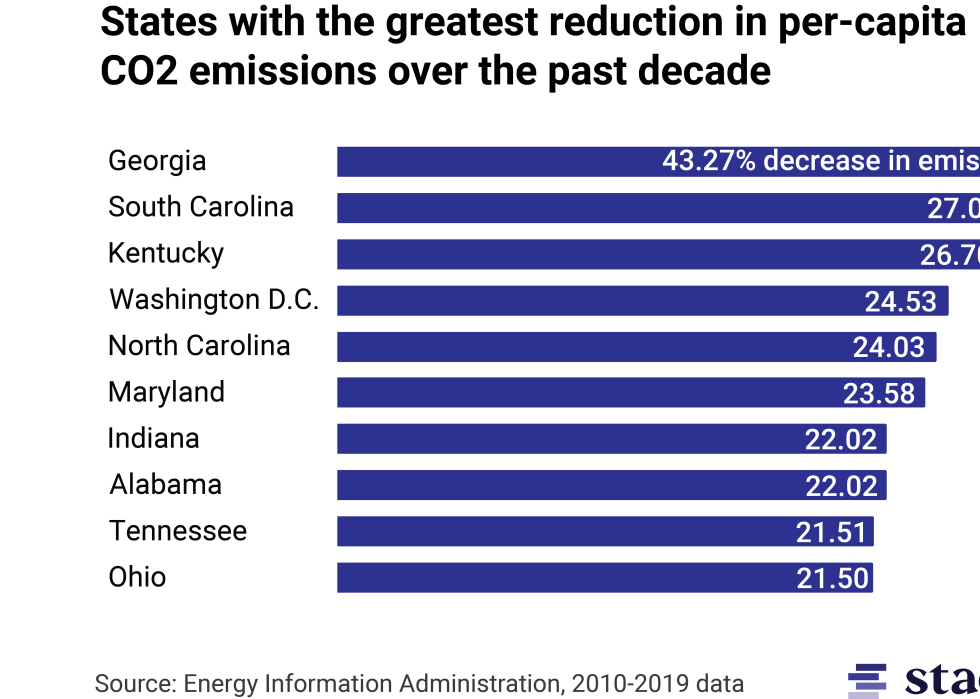
Nearly all states have reduced CO2 emissions in the last decade
Although only four states have seen an increase in per-capita emissions since 2005—Vermont, Connecticut, Idaho, and Washington—they are still among 15 of the lowest emitters nationally. Comparatively, other states have seen a reduction in emissions due to the decline of major industries, such as coal, which contributed to high industrial carbon emissions.
Despite a U.S. Supreme Court stay on the EPA’s 2015 Clean Power Plant Plan in 2016, after which the Georgia Environmental Protection Division paused the development of its own state plan, researchers and private industry took up the mantle for CO2 reduction. Scientists from the Georgia Institute of Technology, the University of Georgia, and Emory University undertook a study that concluded the state could reduce its CO2 emissions to half those emitted in 2005 by 2030 using already available technologies. Georgia Power, the biggest utility provider in the state, submitted a three-year proposal to state regulators in January 2022 outlining plans to eliminate coal altogether by 2028 and to double reliance on renewable energy resources by 2035.
Kentucky is another state reporting major declines, specifically from high-industrial carbon emissions from coal production. The Kentucky Utilities Company in 2009 paid a civil penalty after violating the Clean Air Act and agreed to spend $135 million on pollution controls to resolve previous violations. A decade later, a 2019 Kentucky Energy Profile that looked at the state’s overall energy barometer, while still finding that coal was a primary source of energy, showed that since 1995 the state realized reductions in carbon dioxide (27.5%), sulfur dioxide (91.8%), and nitrogen oxides (87%). The city of Louisville also set a plan for an 80% reduction of carbon emissions by 2050.
When broken down by sector, electricity-related emissions shrink in states with greater reliance on renewables
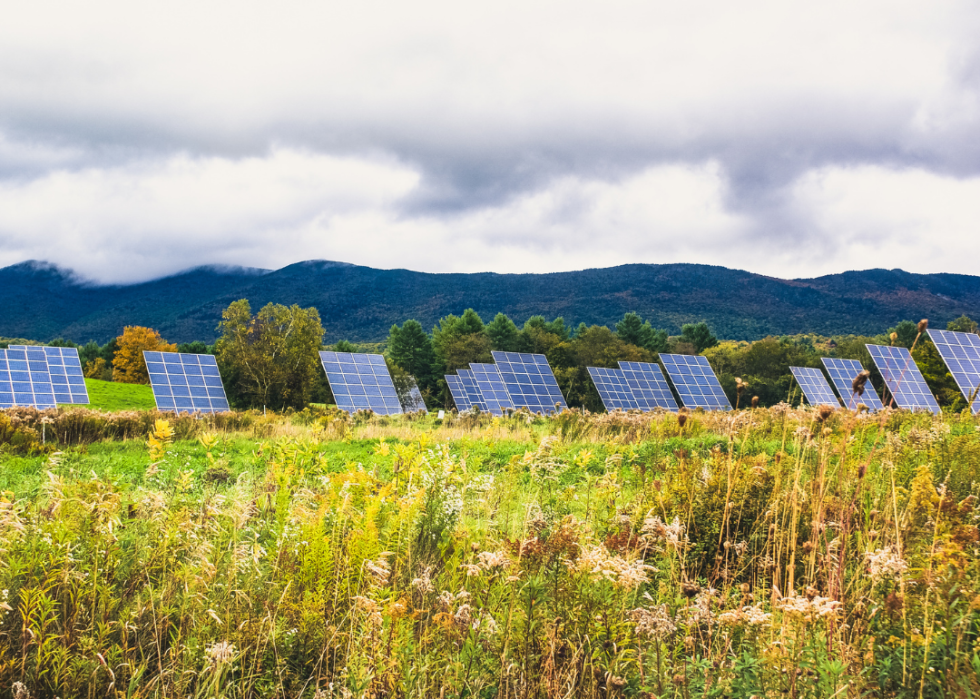
Data shows that states that rely on fossil fuels for electricity generation tend to have higher carbon footprints, as in the cases of Wyoming, North Dakota, Kentucky, and West Virginia—all of which have a heavy reliance on coal. However, states sourcing electricity from renewable sources show significantly smaller carbon footprints. Vermont as of 2020 is the only state that sources all its electricity from such sources, including 54% net generation from hydroelectric dams.
Types of renewable energy sources include solar energy, geothermal energy (heat from inside the earth), wind energy, biomass from plants, and hydropower from flowing water. Unlike fossil fuels, which are extracted from deep within the ground and result in various and numerous environmental complications (think fracking), renewable energy sources are naturally replenished and are easily derived from surrounding sources.

States with cold weather tend to have greater residential carbon footprints
Despite Vermont's low electric-derived emissions, it has the highest per capita residential footprint, due in large part to its geographic location and the weather patterns it sustains as a northern and near-coastal state: New Hampshire’s 68-mile width being all that separates Vermont from the Atlantic.
Many of the coldest states in the U.S. have higher residential carbon footprints due to the amount of residential energy required to keep houses warm during the colder months.
Per capita commercial emissions vary across regions
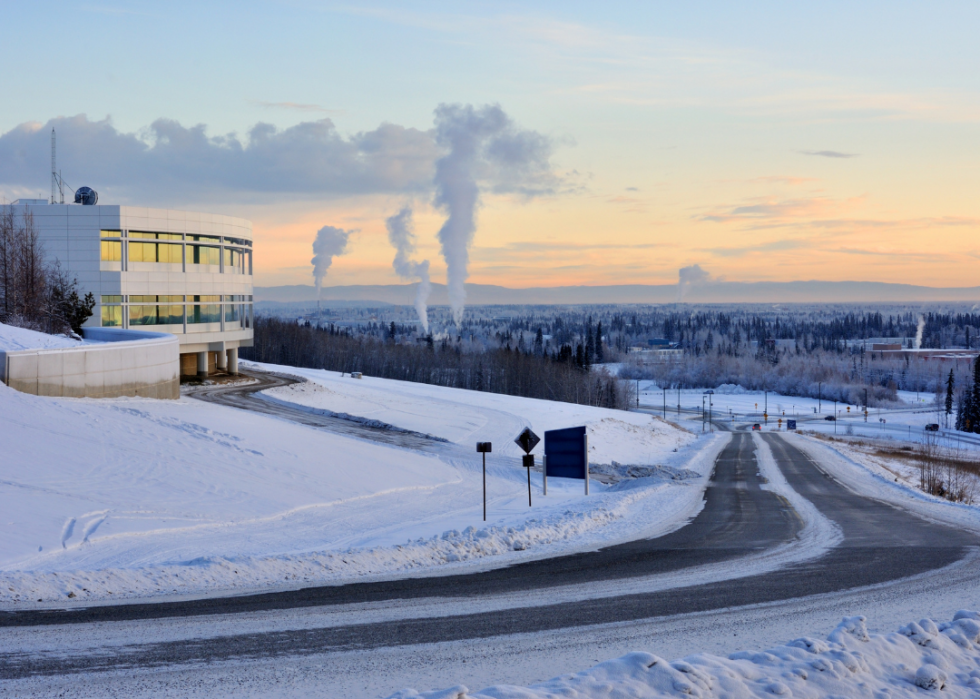
Alaska's primary revenue-generating industries include fishing, oil and gas, logging, and mining, as well as tourism. Each of these industries bears out significant footprints throughout the state.
The Port of Kodiak is one of the largest ports in the U.S. The seafood industry generated $5.6 billion in economic activity during 2017-2018, according to Alaska's Resource Development Council, and employs more than 58,000 people, with another 10,000 supported in secondary jobs. The state has more than 120 shoreside fish processing plants. Alaska also has 129 million acres of forested land, and the oil and gas industry accounts for 1 out of every 4 jobs and produces nearly 500,000 barrels per day. With a state population of just over 736,000, the impact of the commercial industry far outweighs that of the residential impact of its citizenry, from an energy standpoint.
In a state like Florida, on the other hand, where aviation, manufacturing, life sciences, and information technology are the leading industries, the lack of more impactful industry-related CO2 emitting culprits (such as oil, gas, or mining) coupled with a population of more than 21 million on a piece of land less than 10% the size of Alaska results in a lower commercial level of emissions.
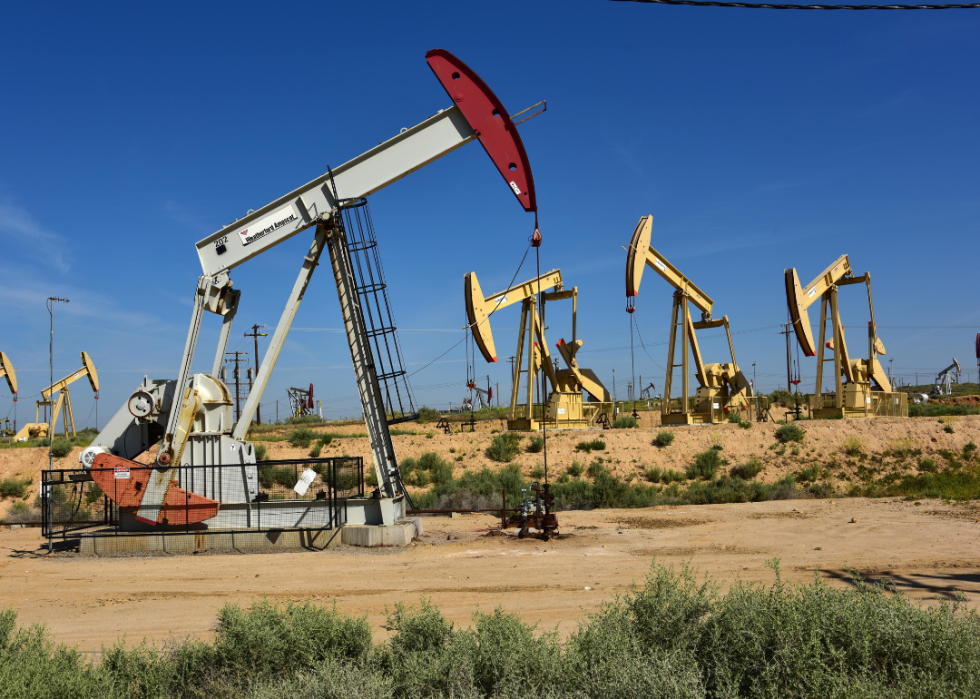
Oil- and gas-producing states have higher industrial footprints
The industrial sector includes facilities related to producing, putting together, and processing goods including activity manufacturing (agriculture, fishing, hunting, etc.), mining (oil and gas), and construction.
The industrial emissions in Alaska, North Dakota, and Wyoming are of little surprise, given the hold oil and gas, as well as mining, has in those states. Louisiana, however, is primarily a chemical industry state: That industry accounts for about one-third of all industrial activity in the state. There are more than 300 chemical production facilities statewide.
The relatively low per-capita CO2 footprint in smaller states, such as Connecticut, Maryland, and Massachusetts, can be attributed to several factors, among them the fact that tourism is a major industry in each state and the absence of the industries that place Alaska et al at the top of the list.

More rural states have higher carbon footprints from transportation
The disparity in CO2 levels from transportation in rural regions can be qualified by more than greater distances between locales or fewer dense urban or metropolitan areas.
Vehicle fuel economy declined for new vehicles produced and sold from 1990 to 2020, while sales of light-duty trucks increased. It is true that fuel economy for light-duty trucks has increased 29% since a recorded low in 2005, however it trails significantly behind nearly all other vehicle types including mid-sized cars and crossovers, which remain the most popular classes in the U.S.
In largely rural states, such as Alaska, Wyoming, North Dakota, Oklahoma, and Texas, as well as numerous others, trucks remain the top-selling vehicles whether used or new.
Rural states also tend to function as throughways for long-haul and train-based freight. Freight and train hauling in 2020 produced 541 million tons of CO2.
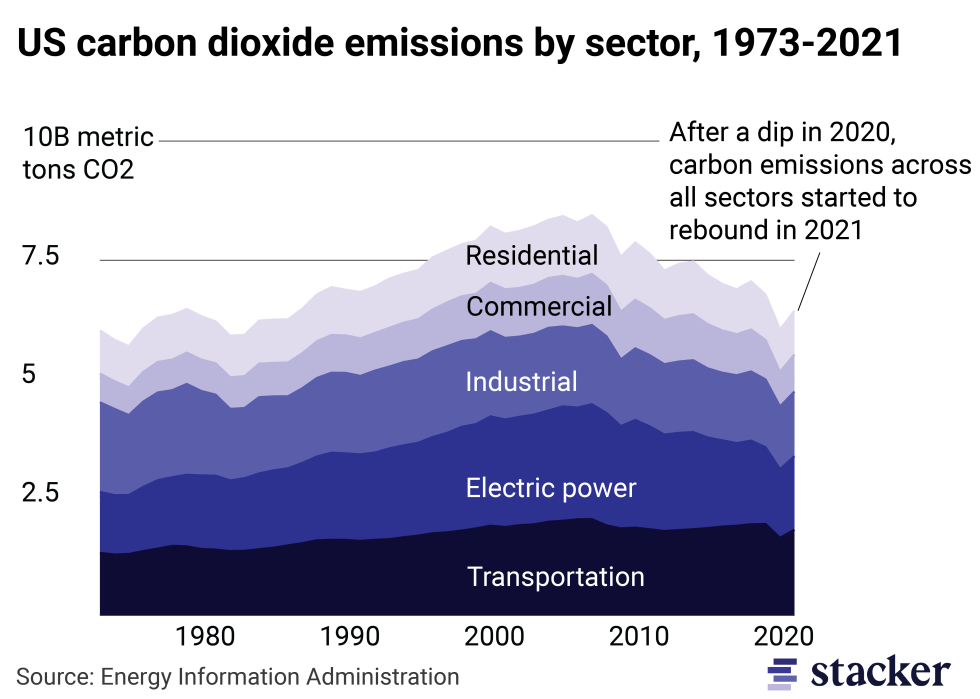
At the national level, carbon emissions peaked during the 2000s
While carbon emission numbers are still high, the percentages have decreased from the peak usage seen in the 2000s. Data confirms the 2020 drop was due to the closing of businesses and the minimal use of transportation during the onset of the coronavirus pandemic, drastically decreasing air pollution in a matter of weeks.
The uptick registered once again in 2021 was in line with society and began to return to pre-COVID behaviors, along with an increase in emissions due to the shipping and delivery of goods, which grew significantly. Although the EIA estimates carbon emission use to increase by 1.3% in 2022, the organization expects a 0.7% drop in 2023.
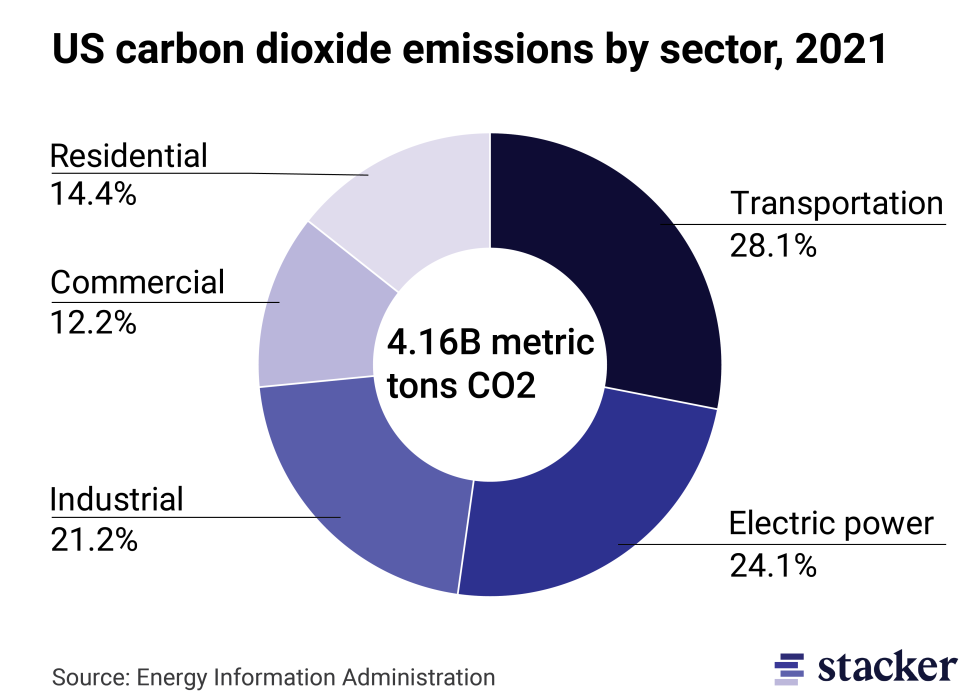
Transportation accounts for the most CO2 emissions nationally
The recognition of transportation’s deleterious effects on the environment played an important role in the Biden-Harris administration’s approach to funding the sector in its Infrastructure Investment and Jobs Act, providing $7.5 billion for electrical vehicle charging infrastructure and more than $7 billion for materials.
The administration also proposed a vision for national electrical car usage, aiming for 50% of vehicles sold to be electric by 2030. The U.S Supreme Court’s June 30, 2022, decision lifting the EPA's ability to regulate greenhouse gas emissions has stunted that plan; however, the major auto manufacturers, including GM and Ford, have stepped up their commitment to electric vehicle development as a core aspect of their business.


