1 / 50
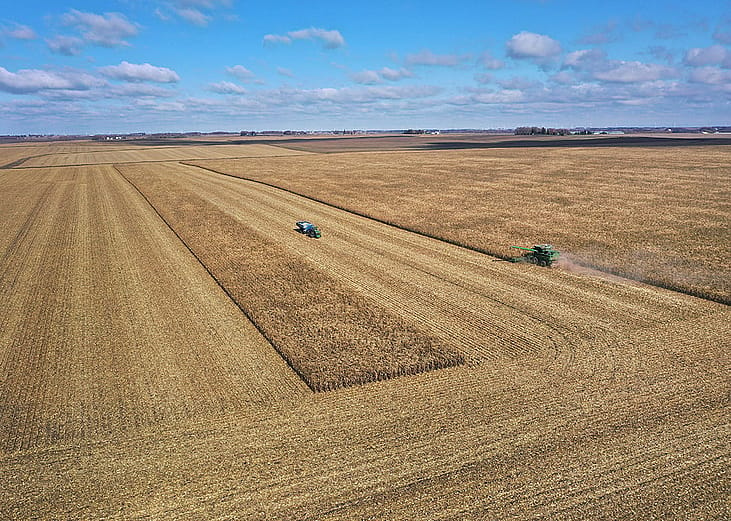
#50. Otsego County, Michigan
Projected days of extreme precipitation in 2050:
- Low emissions scenario: 224 (+58 days from 2016)
- High emissions scenario: 221 (+55 days from 2016)

We all know that climate change affects temperature, but you may not realize that it also affects how much precipitation we get. As the Environmental Protection Agency explains, the higher the temperature of the ocean, the more water evaporates into the air. As it moves over land or potentially converges with a storm system, that moisture-laden air can produce more intense precipitation.
Across the country, heavy precipitation events are increasing—and are projected to continue doing so. More than 10 states set new 24-hour rainfall records in the 21st century, according to a 2024 report published by The Weather Channel, using data from the National Oceanic and Atmospheric Administration. A June report from NOAA noted that the January–June precipitation total for the contiguous U.S. in 2024 was the 11th wettest in its 130-year record. The Upper Midwest, Northeast, and Deep South have all seen above-average rainfall, with a few states getting particularly high levels of precipitation. For Rhode Island, it's been the second-wettest year-to-date on record and the third-wettest for Minnesota and Wisconsin.
To determine how these numbers may shift in the future, Stacker set out to identify the U.S. counties that are expected to see the most extreme precipitation days in 2050 using data from the Centers for Disease Control and Prevention & National Environmental Public Health Tracking Network. They use a 30-year rolling average to calculate the projected amount of days with extreme precipitation. These predictions were last updated in December of 2018.
Counties are ranked by low emission days of extreme precipitation in 2050. The number of extreme precipitation days is relative to days in a year, with the measure calculated annually and representing a 30-year rolling average.
Keep reading to see if your own home county is projected to be among those with the most extreme precipitation days in 2050.
You may also like: 50 of the greatest archaeological discoveries of all time
Projected days of extreme precipitation in 2050:
- Low emissions scenario: 224 (+58 days from 2016)
- High emissions scenario: 221 (+55 days from 2016)
Projected days of extreme precipitation in 2050:
- Low emissions scenario: 225 (+45 days from 2016)
- High emissions scenario: 225 (+45 days from 2016)
Projected days of extreme precipitation in 2050:
- Low emissions scenario: 225 (+57 days from 2016)
- High emissions scenario: 226 (+58 days from 2016)
Projected days of extreme precipitation in 2050:
- Low emissions scenario: 225 (+51 days from 2016)
- High emissions scenario: 223 (+49 days from 2016)
Projected days of extreme precipitation in 2050:
- Low emissions scenario: 225 (+61 days from 2016)
- High emissions scenario: 227 (+63 days from 2016)
You may also like: 2024's most lead paint-vulnerable cities
Projected days of extreme precipitation in 2050:
- Low emissions scenario: 225 (+48 days from 2016)
- High emissions scenario: 222 (+45 days from 2016)
Projected days of extreme precipitation in 2050:
- Low emissions scenario: 225 (+39 days from 2016)
- High emissions scenario: 224 (+38 days from 2016)
Projected days of extreme precipitation in 2050:
- Low emissions scenario: 225 (+32 days from 2016)
- High emissions scenario: 227 (+34 days from 2016)
Projected days of extreme precipitation in 2050:
- Low emissions scenario: 226 (+55 days from 2016)
- High emissions scenario: 225 (+54 days from 2016)
Projected days of extreme precipitation in 2050:
- Low emissions scenario: 226 (+55 days from 2016)
- High emissions scenario: 227 (+56 days from 2016)
You may also like: Carmakers are making more hybrid vehicles than ever. Here's who is dominating the market.
Projected days of extreme precipitation in 2050:
- Low emissions scenario: 226 (+39 days from 2016)
- High emissions scenario: 225 (+38 days from 2016)
Projected days of extreme precipitation in 2050:
- Low emissions scenario: 226 (+66 days from 2016)
- High emissions scenario: 221 (+61 days from 2016)
Projected days of extreme precipitation in 2050:
- Low emissions scenario: 226 (+55 days from 2016)
- High emissions scenario: 223 (+52 days from 2016)
Projected days of extreme precipitation in 2050:
- Low emissions scenario: 226 (+43 days from 2016)
- High emissions scenario: 223 (+40 days from 2016)
Projected days of extreme precipitation in 2050:
- Low emissions scenario: 227 (+57 days from 2016)
- High emissions scenario: 225 (+55 days from 2016)
You may also like: These industries are responsible for the most greenhouse gas emissions
Projected days of extreme precipitation in 2050:
- Low emissions scenario: 227 (+57 days from 2016)
- High emissions scenario: 229 (+59 days from 2016)
Projected days of extreme precipitation in 2050:
- Low emissions scenario: 227 (+61 days from 2016)
- High emissions scenario: 227 (+61 days from 2016)
Projected days of extreme precipitation in 2050:
- Low emissions scenario: 227 (+56 days from 2016)
- High emissions scenario: 226 (+55 days from 2016)
Projected days of extreme precipitation in 2050:
- Low emissions scenario: 228 (+56 days from 2016)
- High emissions scenario: 227 (+55 days from 2016)
Projected days of extreme precipitation in 2050:
- Low emissions scenario: 228 (+62 days from 2016)
- High emissions scenario: 226 (+60 days from 2016)
You may also like: The house of the future will be recyclable: Introducing the first affordable, bio-based 3D-printed house
Projected days of extreme precipitation in 2050:
- Low emissions scenario: 228 (+55 days from 2016)
- High emissions scenario: 229 (+56 days from 2016)
Projected days of extreme precipitation in 2050:
- Low emissions scenario: 229 (+53 days from 2016)
- High emissions scenario: 228 (+52 days from 2016)
Projected days of extreme precipitation in 2050:
- Low emissions scenario: 230 (+63 days from 2016)
- High emissions scenario: 228 (+61 days from 2016)
Projected days of extreme precipitation in 2050:
- Low emissions scenario: 230 (+55 days from 2016)
- High emissions scenario: 225 (+50 days from 2016)
Projected days of extreme precipitation in 2050:
- Low emissions scenario: 230 (+34 days from 2016)
- High emissions scenario: 228 (+32 days from 2016)
You may also like: With an urban design mimicking natural forests, Colombia's second-largest city cools dramatically in just three years
Projected days of extreme precipitation in 2050:
- Low emissions scenario: 230 (+64 days from 2016)
- High emissions scenario: 228 (+62 days from 2016)
Projected days of extreme precipitation in 2050:
- Low emissions scenario: 230 (+44 days from 2016)
- High emissions scenario: 228 (+42 days from 2016)
Projected days of extreme precipitation in 2050:
- Low emissions scenario: 231 (+51 days from 2016)
- High emissions scenario: 232 (+52 days from 2016)
Projected days of extreme precipitation in 2050:
- Low emissions scenario: 231 (+66 days from 2016)
- High emissions scenario: 230 (+65 days from 2016)
Projected days of extreme precipitation in 2050:
- Low emissions scenario: 232 (+53 days from 2016)
- High emissions scenario: 230 (+51 days from 2016)
You may also like: 10 ways cities are going green
Projected days of extreme precipitation in 2050:
- Low emissions scenario: 233 (+67 days from 2016)
- High emissions scenario: 233 (+67 days from 2016)
Projected days of extreme precipitation in 2050:
- Low emissions scenario: 233 (+47 days from 2016)
- High emissions scenario: 230 (+44 days from 2016)
Projected days of extreme precipitation in 2050:
- Low emissions scenario: 233 (+45 days from 2016)
- High emissions scenario: 232 (+44 days from 2016)
Projected days of extreme precipitation in 2050:
- Low emissions scenario: 233 (+60 days from 2016)
- High emissions scenario: 234 (+61 days from 2016)
Projected days of extreme precipitation in 2050:
- Low emissions scenario: 234 (+44 days from 2016)
- High emissions scenario: 237 (+47 days from 2016)
You may also like: How farmers used California's floods to revive underground aquifers
Projected days of extreme precipitation in 2050:
- Low emissions scenario: 234 (+25 days from 2016)
- High emissions scenario: 229 (+20 days from 2016)
Projected days of extreme precipitation in 2050:
- Low emissions scenario: 234 (+49 days from 2016)
- High emissions scenario: 237 (+52 days from 2016)
Projected days of extreme precipitation in 2050:
- Low emissions scenario: 235 (+70 days from 2016)
- High emissions scenario: 234 (+69 days from 2016)
Projected days of extreme precipitation in 2050:
- Low emissions scenario: 235 (+46 days from 2016)
- High emissions scenario: 234 (+45 days from 2016)
Projected days of extreme precipitation in 2050:
- Low emissions scenario: 235 (+62 days from 2016)
- High emissions scenario: 234 (+61 days from 2016)
You may also like: 8 years into America's e-scooter experiment, what have we learned?
Projected days of extreme precipitation in 2050:
- Low emissions scenario: 236 (+51 days from 2016)
- High emissions scenario: 233 (+48 days from 2016)
Projected days of extreme precipitation in 2050:
- Low emissions scenario: 237 (+48 days from 2016)
- High emissions scenario: 234 (+45 days from 2016)
Projected days of extreme precipitation in 2050:
- Low emissions scenario: 238 (+64 days from 2016)
- High emissions scenario: 237 (+63 days from 2016)
Projected days of extreme precipitation in 2050:
- Low emissions scenario: 238 (+32 days from 2016)
- High emissions scenario: 235 (+29 days from 2016)
Projected days of extreme precipitation in 2050:
- Low emissions scenario: 239 (+68 days from 2016)
- High emissions scenario: 238 (+67 days from 2016)
You may also like: Landfills in Washington and Oregon leaked 'explosive' levels of methane last year
Projected days of extreme precipitation in 2050:
- Low emissions scenario: 239 (+65 days from 2016)
- High emissions scenario: 238 (+64 days from 2016)
Projected days of extreme precipitation in 2050:
- Low emissions scenario: 242 (+55 days from 2016)
- High emissions scenario: 244 (+57 days from 2016)
Projected days of extreme precipitation in 2050:
- Low emissions scenario: 243 (+57 days from 2016)
- High emissions scenario: 242 (+56 days from 2016)
Projected days of extreme precipitation in 2050:
- Low emissions scenario: 244 (+52 days from 2016)
- High emissions scenario: 242 (+50 days from 2016)
Projected days of extreme precipitation in 2050:
- Low emissions scenario: 248 (+72 days from 2016)
- High emissions scenario: 246 (+70 days from 2016)
You may also like: Why can't we just quit cows?