
Are you rich for your age or just keeping up?
Are you rich or broke for your age? CreditNinja dug into the data to find out what actually makes you rich or poor for your age, and chances are you’re way off about where you really stand with your financial plan.
Key Takeaways
- You are likely not “rich” or “poor” for your age unless your net worth and retirement savings are far above or below the median benchmarks for your decade.
- Median income and net worth are much lower than averages suggest, especially in your 20s and 30s, because high earners skew the data.
- Debt tends to rise through your 30s and 40s due to homes, cars, and family costs, then declines in later decades as mortgages are paid down.
- Starting to invest early and consistently, even with small amounts, has a much bigger impact on long-term wealth than trying to catch up later.
Average Wealth for Your 20s
The average annual income for a person in their 20s is about $43,500. The average net worth is $110,000. While that number is correct, the truth is the average is very, very misleading.
Averages are skewed by outliers. In this case, outliers are people in their 20s who are making much more than average. So, instead of their average income, using their median income is a more realistic representation of the population because it shows the middle point where half of the people earn more and half of the people earn less.
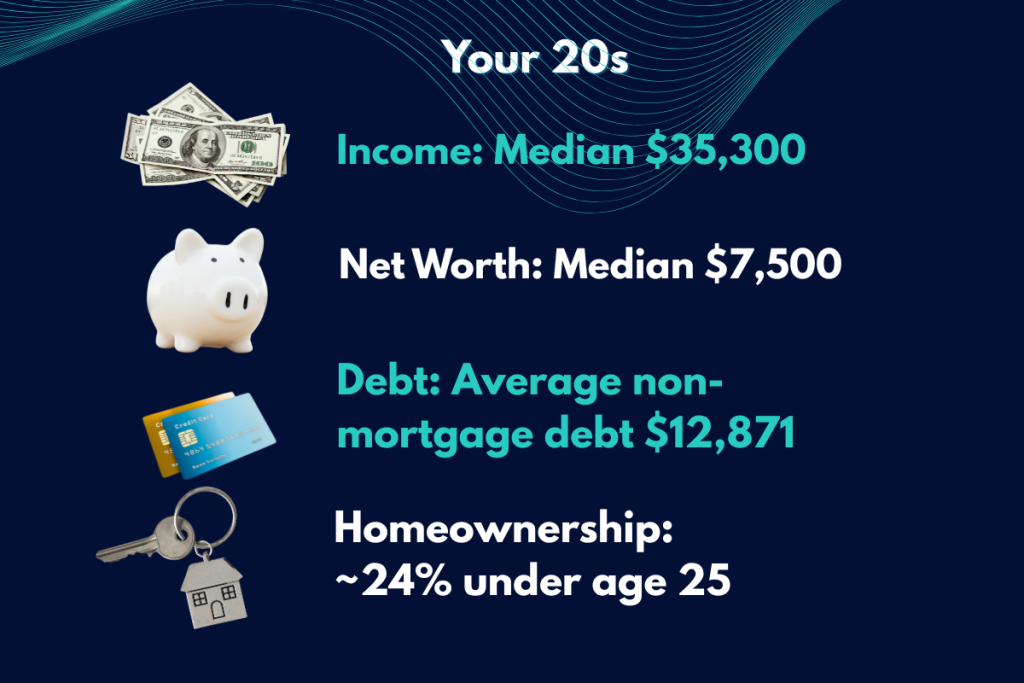
The median income for a person in their 20s drops to $35,300 per year. The net worth drops even further from over $110,000 to just $7,500.
Net worth isn’t just income. It includes things like your home and retirement accounts, which you’re more likely to have by your late 20s. So hopefully you’re starting to feel better about yourself if you’re in this age group or if you’re thinking about where you were in your 20s.
But what about debt statistics? Debt.org calculates the average nonmortgage debt of an 18- to 29-year-old at $12,871. This includes things like student loans and car payments. As discussed, the average probably can’t be fully trusted, since it could be skewed by people who are paying more than what they can afford for their car.
But even if the median is a lot lower, what makes up this age bracket’s debt? As you can imagine, a lot of it is student loans. The median amount of debt is around $15,000 of student loan debt for those under 25. Credit card debt is also pretty common. It hovers around the $3,000 mark. It’s important to keep credit card debt as small as possible because high interest rates can make it challenging to manage over time.
- Average nonmortgage debt (18- to 29-year-olds): $12,871
- Median student loan debt (under 25): around $15,000
- Credit card debt: around the $3,000 mark
It should be clear by now that your 20s are when your financial life and career really begin. Which is why it might surprise some to learn that nearly 24% of Americans under the age of 25 own their own home. Seventy-nine percent of 18- to 29-year-old homeowners were helped financially by their parents. Not all of us are this lucky.
- Just 10% of Americans in their 20s who own a home did so without the help of their parents.
- Nearly 24% of Americans under 25 own their own home.
- 79% of 18- to 29-year-old homeowners were helped financially by their parents.
- Just 10% of Americans in their 20s who own a home did so without parental help.
If you’re in your 20s and don’t feel too great about where you stand compared to your peers, first of all, don’t worry. You have all the time in the world to catch up.
Average Wealth for Your 30s
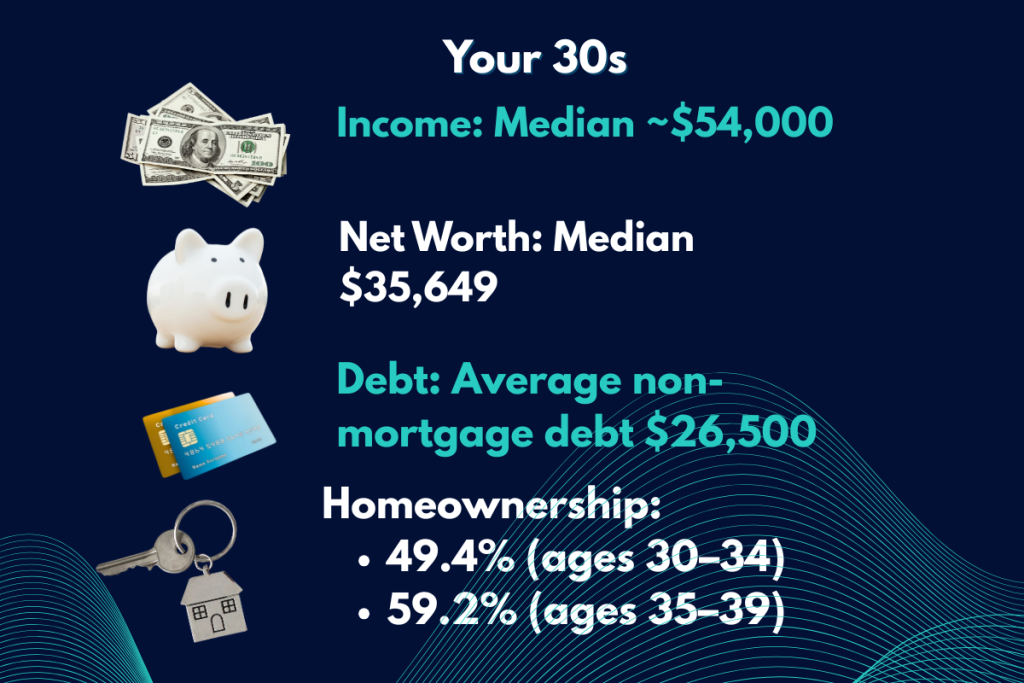
For those in their 30s, the median is around $54,000 a year, which is a nice boost in income compared to their 20s. The median net worth for this age group is $35,649, almost five times more than in their 20s. However, on average, your 30s are an incredibly expensive time. A lot of people are getting married, having children, and buying homes. And that’s reflected in the increase in debt compared to the previous age group.
The average nonmortgage debt rises from $12,800 for those in their 20s to $26,500 for those in their 30s. Credit Karma did a survey and found that compared to Zoomers, millennials have double the average credit card debt and double the average student loan debt. And while the millennial generation isn’t exclusively made up of people in their 30s, it’s still pretty interesting to see the increase in debt.
- Average nonmortgage debt (20s): $12,800
- Average nonmortgage debt (30s): $26,500
Compared to Zoomers, millennials have:
- Double the average credit card debt
- Double the average student loan debt
People in their 30s also have higher auto loan debt than any other age group. Then there’s the homeownership rate, which rises quickly from 49.4% for 30- to 34-year-olds to 59.2% for 35- to 39-year-olds, suggesting that a bunch of people get on the home-buying train later in their 30s.
For many people in their 30s, trying to find the right balance of spending and saving can be really tricky.
Average Wealth for Your 40s
For most, your 40s are a great time, at least in terms of finances. Americans often hit their career peak in their 40s due to decades of experience, strong professional networks, and the transition into leadership roles and higher salaries, which shows in their income.
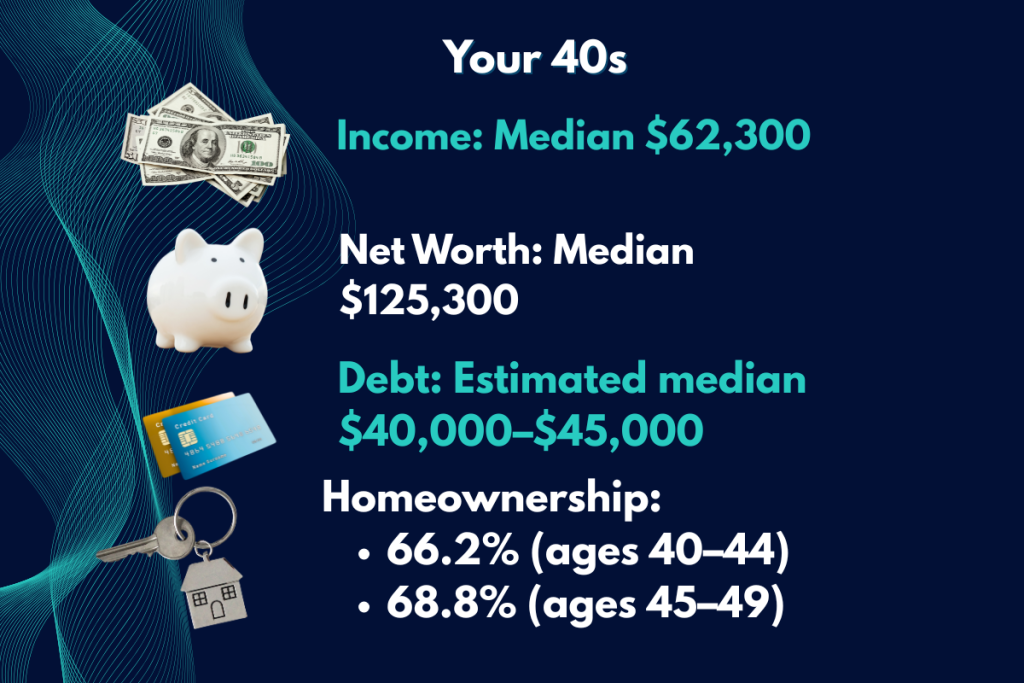
The median annual income for this age group rises to $62,300, and the median net worth rises to $125,300. But as the income goes up, so does the amount of debt. People in their 40s hold a larger amount of debt than any other age group. Mainly thanks to, drum roll, home mortgages.
People in their 40s hold more debt than any other age group (mainly mortgages)
While it’s not exclusively people in their 40s, the average Gen Xer’s debt was $61,000. So one could probably safely assume that the median debt for people in their 40s is around $40,000 to $45,000. The homeownership rate for this age bracket is 66.2% between the ages of 40 and 44 and rises to 68.8% between the ages of 45 and 49.
Average Wealth for your 50s
For most Americans, their 50s are when they begin to slow down a bit, at least in terms of income. The median annual income for the age group actually decreases as the decade goes on. Luckily, one thing that doesn’t decrease is net worth, which for this age range reaches a median of about $288,000.

This is from a combination of paying into retirement plans like a 401(k) or Roth IRA and paying off your mortgage, which means you own a larger amount of your home. The homeownership rate reaches 75% between 55 and 59, which shows just how many people are settling down.
Net worth growth comes from:
- Paying into retirement plans (401(k), Roth IRA)
- Paying off your mortgage (more home equity)
But as their assets rise in value, so do their costs. This age group leads in total credit card debt across all age groups. The number of bankruptcy filings is also surprisingly high for this age group, which could be caused by overspending during your 40s at the peak of your income. Overspending as you make more money is called lifestyle creep, and it’s why most people still live paycheck to paycheck.
- This age group leads in total credit card debt across all age groups
- Bankruptcy filings are surprisingly high for this age group
- Overspending as you make more money is called lifestyle creep
Average Wealth for your 60s
For most Americans in their 60s, the median salary for this age group is $55,740. This is the first noticeable decrease. This decrease is likely because most people retire during their 60s, and they need to start relying on their retirement funds, social security, and paid-off assets to live.
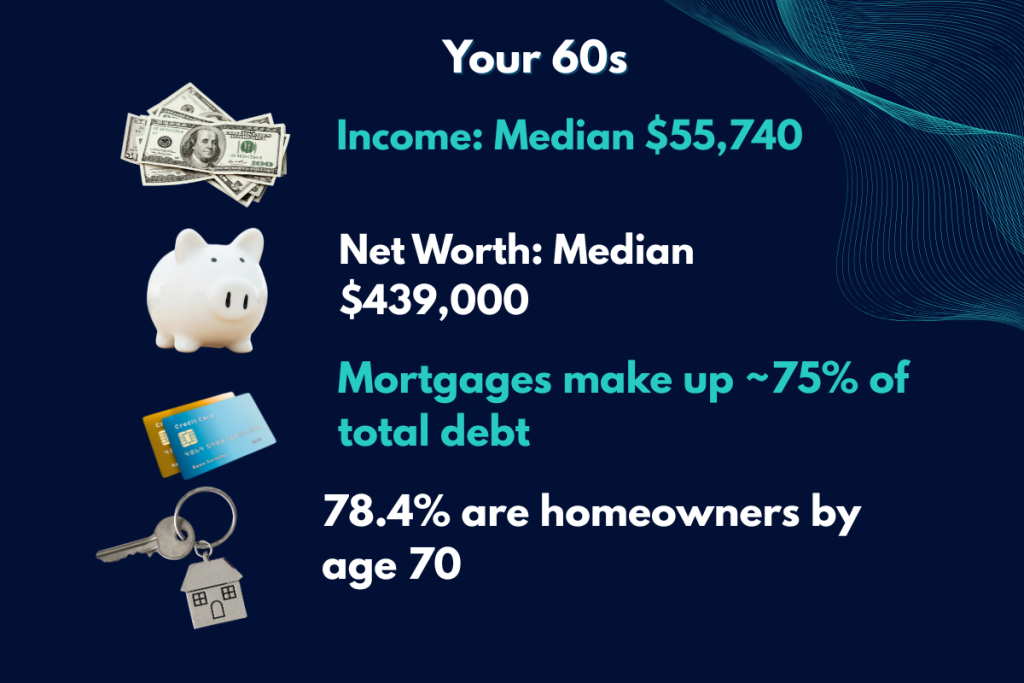
Luckily, the median person in this age bracket has done all right for themselves with a net worth of $439,000, largely thanks to people paying off their mortgage. Now what about homeownership? By the time they’re 70, 78.4% of people are homeowners. But how is the debt looking? Well, mortgages account for just under 75% of the age group’s total debt with pretty much everything else almost paid off.
How Do You Compare?
Now it’s time to figure out if you’re rich or you’re poor for your age. And this will give you some goals to aim for as time goes on. For starters, look at how much you want to have in your retirement accounts. This does not include how much you should have in your bank account.
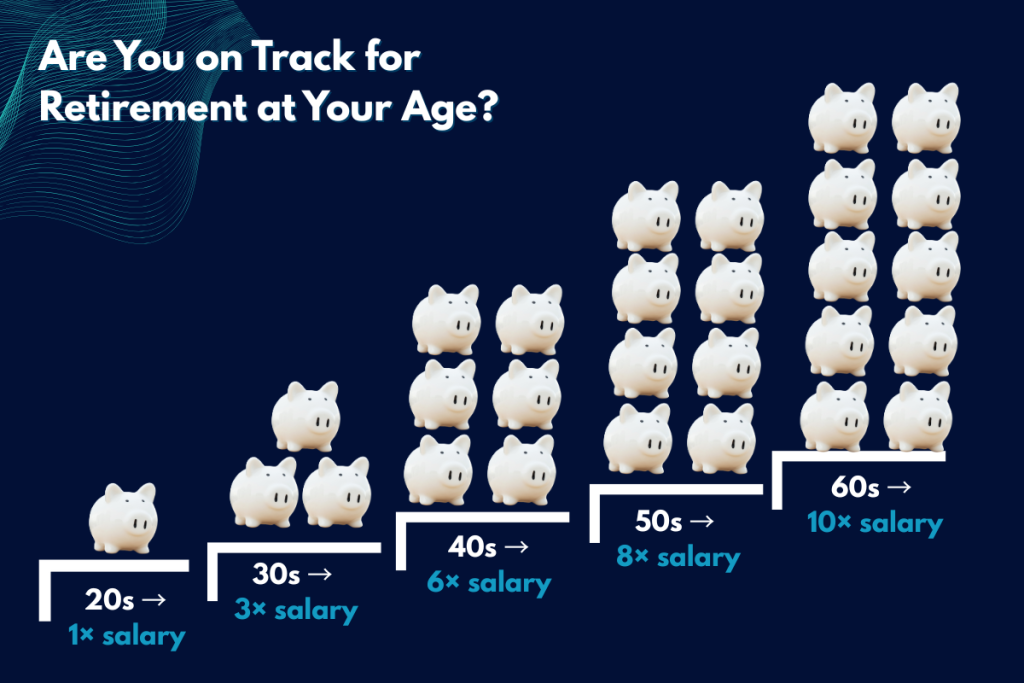
As you can see, if you’re in your 20s, having the equivalent of your salary saved in your retirement account is considered good. And as you go up, you can see it increases to three times in your 30s and six times in your 40s. We see the biggest jumps here because this is where you start making some of your biggest career changes, which means more money. If you’re in your 50s, try to hit eight times.
And this is a great time to focus on paying off your mortgage and setting a clear goal for your annual retirement spending.
By your 60s, you should target 10 times your salary with your home fully paid off as a bonus.
The Importance of Investing
Another goal to really increase your net worth is investing—and investing as early as possible. This is because of what’s known as compound interest. Here’s how it works.
If you’re in your 20s and invest just $100 a month in index funds, at the end of one year, you’d have invested $1,200. The average index fund returns of the S&P 500 are about 8% to 10% every year. So if you take $1,200 and multiply it by 8%, you get $96. So now you have $1,296 after one year invested in the stock market.
Then, in year two, you take your new total, which is $1,296, and multiply it by 8% and get $103 in profit.
If your money is still doing this until you retire at the age of 65, it could grow to around $38,000. But if you delay your start by just 10 years, that same $1,200 might only grow to around $18,000, leaving you with a potential $20,000 shortfall.
- $100/month = $1,200/year invested
- Average S&P 500 index fund returns: about 8% to 10% per year
- Starting in your 20s could grow to around $38,000 by age 65
- Delaying by 10 years could leave you with around $18,000
- Potential shortfall: about $20,000
So if you’re young, the best thing you can do is just get started. Most companies make it pretty easy to auto-deduct money from each paycheck and invest it into index funds so you never have to touch it. This is usually around four to 5% of your salary, but you can always do more if you’d like.
Some employers even have matching programs where they match the money you put into the retirement account. It’s free money that you essentially forget about but will have massive returns in the long run. You can also check a retirement calculator for more insight.
This story was produced by CreditNinja and reviewed and distributed by Stacker.


