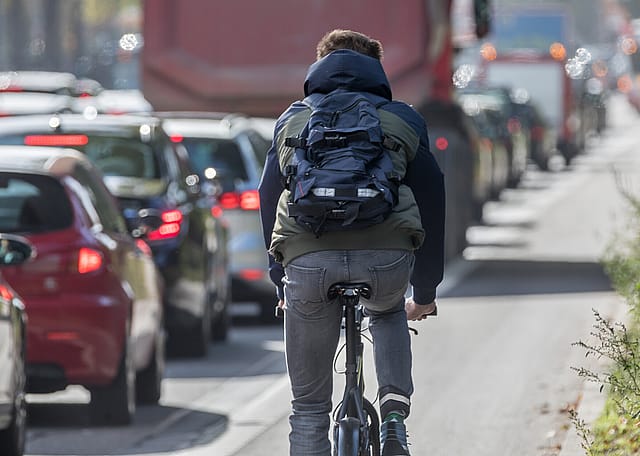
Stacker compiled a list of the counties with the best commutes in South Dakota using data from the U.S. Census Bureau. Counties are ranked by the shortest average travel time to work, with ties broken by lowest percent of residents that commute over 60 minutes, and any further ties broken by lowest percent of residents that work outside the county of residence.
You may also like: Cities with the fastest-growing home prices in South Dakota
JERRYE AND ROY KLOTZ MD // Wikimedia Commons
1 / 50#50. Clark County
- Mean travel time to work: 20.0
- Workers with 60+ minute commute: 3.9%
- Worked outside of county of residence: 29.9%
#49. Mellette County
- Mean travel time to work: 19.4
- Workers with 60+ minute commute: 1.7%
- Worked outside of county of residence: 29.5%
AlexiusHoratius // Wikimedia Commons
3 / 50#48. Lincoln County
- Mean travel time to work: 19.2
- Workers with 60+ minute commute: 2.3%
- Worked outside of county of residence: 61.0%
Jimmy Emerson, DVM // Flickr
4 / 50#47. Moody County
- Mean travel time to work: 19.0
- Workers with 60+ minute commute: 3.0%
- Worked outside of county of residence: 33.8%
Ammodramus // Wikimedia Commons
6 / 50#45. Union County
- Mean travel time to work: 18.8
- Workers with 60+ minute commute: 3.1%
- Worked outside of county of residence: 13.2%
Ammodramus // Wikimedia Commons
7 / 50#44. Marshall County
- Mean travel time to work: 18.4
- Workers with 60+ minute commute: 5.2%
- Worked outside of county of residence: 21.6%
#43. Lawrence County
- Mean travel time to work: 18.3
- Workers with 60+ minute commute: 6.0%
- Worked outside of county of residence: 17.0%
tochichi//Wikicommons
9 / 50#42. Pennington County
- Mean travel time to work: 18.3
- Workers with 60+ minute commute: 3.0%
- Worked outside of county of residence: 5.3%
Jimmy Emerson, DVM // Flickr
10 / 50Sdgjake // Wikimedia Commons
11 / 50#40. Hutchinson County
- Mean travel time to work: 18.0
- Workers with 60+ minute commute: 5.4%
- Worked outside of county of residence: 23.7%
Ammodramus // Wikimedia Commons
12 / 50#39. Aurora County
- Mean travel time to work: 17.9
- Workers with 60+ minute commute: 2.2%
- Worked outside of county of residence: 34.3%
Ammodramus // Wikimedia Commons
13 / 50#38. Todd County
- Mean travel time to work: 17.9
- Workers with 60+ minute commute: 1.2%
- Worked outside of county of residence: 2.5%
Steven Frame // Shutterstock
14 / 50#37. Minnehaha County
- Mean travel time to work: 17.8
- Workers with 60+ minute commute: 2.4%
- Worked outside of county of residence: 11.2%
JERRYE AND ROY KLOTZ MD // Wikimedia Commons
15 / 50Jon Roanhaus // Wikimedia Commons
16 / 50#35. Kingsbury County
- Mean travel time to work: 17.7
- Workers with 60+ minute commute: 3.7%
- Worked outside of county of residence: 29.1%
#34. Lake County
- Mean travel time to work: 17.4
- Workers with 60+ minute commute: 4.4%
- Worked outside of county of residence: 22.4%
Betsy Armour // Wikimedia Commons
18 / 50#33. Roberts County
- Mean travel time to work: 17.3
- Workers with 60+ minute commute: 3.3%
- Worked outside of county of residence: 11.8%
#32. Oglala Lakota County
- Mean travel time to work: 17.1
- Workers with 60+ minute commute: 4.7%
- Worked outside of county of residence: 5.2%
Sdgjake // Wikimedia Commons
20 / 50USDA // Wikimedia Commons
21 / 50#30. Campbell County
- Mean travel time to work: 16.7
- Workers with 60+ minute commute: 2.7%
- Worked outside of county of residence: 12.4%
Justinebelden // Wikimedia Commons
22 / 50#29. Harding County
- Mean travel time to work: 16.5
- Workers with 60+ minute commute: 4.0%
- Worked outside of county of residence: 1.0%
User:Magicpiano // Wikimedia Commons
23 / 50#28. Clay County
- Mean travel time to work: 16.3
- Workers with 60+ minute commute: 5.3%
- Worked outside of county of residence: 20.1%
Runner1928 // Wikimedia Commons
24 / 50#27. Dewey County
- Mean travel time to work: 16.3
- Workers with 60+ minute commute: 2.0%
- Worked outside of county of residence: 11.7%
Ammodramus // Wikimedia Commons
25 / 50Ammodramus // Wikimedia Commons
26 / 50#25. Jerauld County
- Mean travel time to work: 16.1
- Workers with 60+ minute commute: 4.8%
- Worked outside of county of residence: 18.0%
JERRYE AND ROY KLOTZ MD // Wikimedia Commons
27 / 50#24. Sully County
- Mean travel time to work: 16.1
- Workers with 60+ minute commute: 2.2%
- Worked outside of county of residence: 14.2%
#23. Stanley County
- Mean travel time to work: 15.7
- Workers with 60+ minute commute: 2.1%
- Worked outside of county of residence: 63.9%
Rolf Blauert Dk4hb // Wikimedia Commons
29 / 50#22. Lyman County
- Mean travel time to work: 14.9
- Workers with 60+ minute commute: 4.2%
- Worked outside of county of residence: 27.3%
Tony Webster from Minneapolis, Minnesota // Wikimedia Commons
30 / 50#21. Walworth County
- Mean travel time to work: 14.8
- Workers with 60+ minute commute: 4.4%
- Worked outside of county of residence: 13.5%
You may also like: Best colleges in South Dakota
Ammodramus // Wikimedia Commons
31 / 50#20. Tripp County
- Mean travel time to work: 14.6
- Workers with 60+ minute commute: 3.2%
- Worked outside of county of residence: 9.6%
Jon Platek // Wikimedia Commons
32 / 50#19. Brookings County
- Mean travel time to work: 14.6
- Workers with 60+ minute commute: 2.5%
- Worked outside of county of residence: 7.6%
#18. Codington County
- Mean travel time to work: 14.6
- Workers with 60+ minute commute: 2.3%
- Worked outside of county of residence: 7.4%
J. Stephen Conn // Flickr
34 / 50#17. Hyde County
- Mean travel time to work: 14.4
- Workers with 60+ minute commute: 2.6%
- Worked outside of county of residence: 7.3%
JERRYE AND ROY KLOTZ MD // Wikimedia Commons
35 / 50J. Stephen Conn // Flickr
36 / 50#15. Hand County
- Mean travel time to work: 14.4
- Workers with 60+ minute commute: 1.5%
- Worked outside of county of residence: 10.6%
Matt Lemmon (mattlemmon) // Wikimedia Commons
37 / 50#14. Perkins County
- Mean travel time to work: 14.1
- Workers with 60+ minute commute: 4.3%
- Worked outside of county of residence: 2.2%
#13. Beadle County
- Mean travel time to work: 14.1
- Workers with 60+ minute commute: 2.6%
- Worked outside of county of residence: 11.1%
Amphibol // Wikimedia Commons
39 / 50#12. Brule County
- Mean travel time to work: 14.0
- Workers with 60+ minute commute: 3.5%
- Worked outside of county of residence: 16.8%
Ammodramus // Wikimedia Commons
40 / 50Ammodramus // Wikimedia Commons
41 / 50#10. Yankton County
- Mean travel time to work: 13.9
- Workers with 60+ minute commute: 2.9%
- Worked outside of county of residence: 5.5%
Harry Weddington, U.S. Army Corps of Engineers // Wikimedia Commons
42 / 50#9. Buffalo County
- Mean travel time to work: 13.9
- Workers with 60+ minute commute: 0.0%
- Worked outside of county of residence: 31.1%
Jon Roanhaus // Wikimedia Commons
43 / 50#8. Grant County
- Mean travel time to work: 13.8
- Workers with 60+ minute commute: 3.4%
- Worked outside of county of residence: 7.8%
Magicpiano // Wikimedia Commons
44 / 50#7. Jones County
- Mean travel time to work: 13.6
- Workers with 60+ minute commute: 5.3%
- Worked outside of county of residence: 13.8%
Jonathunder // Wikimedia Commons
45 / 50Winkelvi // Wikimedia Commons
46 / 50#5. Brown County
- Mean travel time to work: 13.3
- Workers with 60+ minute commute: 1.4%
- Worked outside of county of residence: 2.8%
Ammodramus // Wikimedia Commons
47 / 50#4. Bennett County
- Mean travel time to work: 12.4
- Workers with 60+ minute commute: 2.4%
- Worked outside of county of residence: 16.0%
#3. Hughes County
- Mean travel time to work: 12.4
- Workers with 60+ minute commute: 1.8%
- Worked outside of county of residence: 9.2%
JERRYE AND ROY KLOTZ MD // Wikimedia Commons
49 / 50#2. Potter County
- Mean travel time to work: 12.1
- Workers with 60+ minute commute: 3.2%
- Worked outside of county of residence: 8.2%
Charles W. Chapman // Wikimedia Commons
50 / 50