Counties in Virginia where people spend most of their paycheck on housing
Counties in Virginia where people spend most of their paycheck on housing
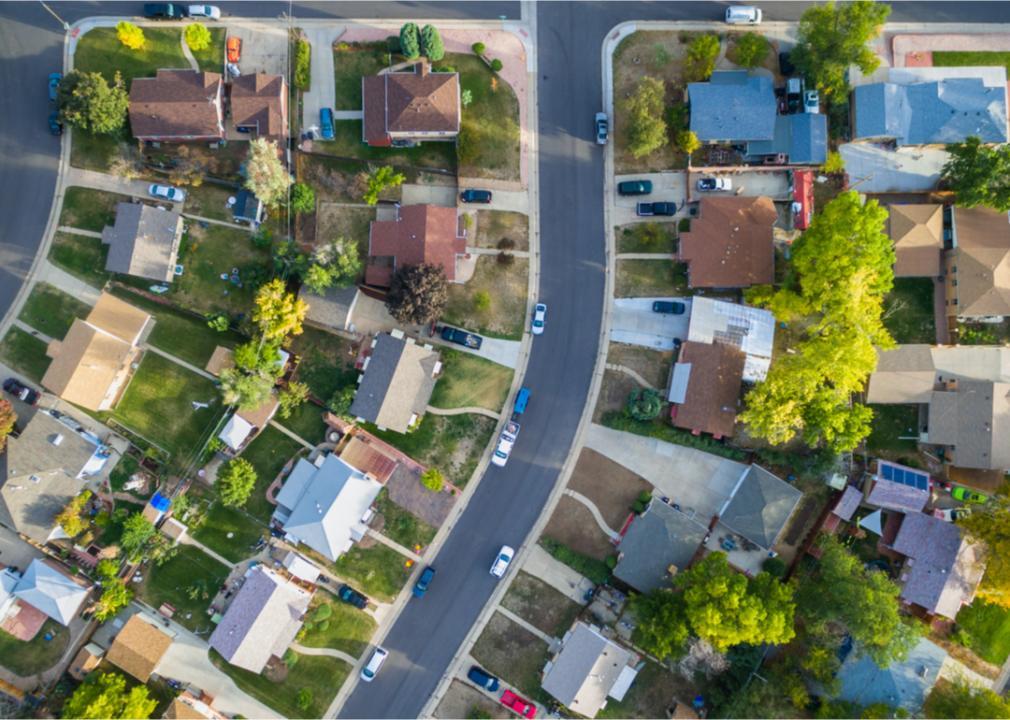
It's no secret that many Americans are forgoing homeownership in favor of renting. In 2020, renters in the U.S. occupied 43 million housing units.
The Stacker team looked at data from a United States Census survey that revealed an estimated 43,378,800 renter-occupied homes in the United States as of 2017, which makes up 36.1% of all households in the country. In 2019, renting was more affordable than buying a median-priced home in 59% of the counties; in 2021, the opposite was true: Owning was more affordable than renting in 63% of U.S. counties.
Stacker compiled a list of counties in Virginia where people spend the highest percent of income on rent using data from the U.S. Census Bureau. Of course, saving money by owning a home is unattainable for many Americans who don't have savings that could cover a down payment, those who are denied a mortgage, or both. Keep reading to see where in your home state most of people's take-home pay goes to their monthly rent.
You may also like: Most popular boy names in the 80s in Virginia
#50. Fairfax County
- Median percent of income spent on housing: 20.3%
--- Percent of households spending <20% of income on housing: 44.8%
--- Percent of households spending >30% of income on housing: 29.1%
- Total occupied households: 396,501
- Median household income: $124,831
- Median monthly housing cost: $2,110
#49. Essex County
- Median percent of income spent on housing: 20.3%
--- Percent of households spending <20% of income on housing: 45.4%
--- Percent of households spending >30% of income on housing: 31.5%
- Total occupied households: 4,555
- Median household income: $51,954
- Median monthly housing cost: $879
#48. Fauquier County
- Median percent of income spent on housing: 20.4%
--- Percent of households spending <20% of income on housing: 44.6%
--- Percent of households spending >30% of income on housing: 26.5%
- Total occupied households: 24,562
- Median household income: $100,783
- Median monthly housing cost: $1,717
#47. Warren County
- Median percent of income spent on housing: 20.5%
--- Percent of households spending <20% of income on housing: 49.6%
--- Percent of households spending >30% of income on housing: 24.9%
- Total occupied households: 14,651
- Median household income: $69,116
- Median monthly housing cost: $1,179
#46. Montgomery County
- Median percent of income spent on housing: 20.6%
--- Percent of households spending <20% of income on housing: 49.4%
--- Percent of households spending >30% of income on housing: 28.2%
- Total occupied households: 35,685
- Median household income: $57,977
- Median monthly housing cost: $994
You may also like: Highest-rated things to do in Virginia, according to Tripadvisor
#45. King William County
- Median percent of income spent on housing: 20.6%
--- Percent of households spending <20% of income on housing: 47.0%
--- Percent of households spending >30% of income on housing: 23.1%
- Total occupied households: 6,078
- Median household income: $66,987
- Median monthly housing cost: $1,150
#44. Spotsylvania County
- Median percent of income spent on housing: 20.7%
--- Percent of households spending <20% of income on housing: 47.1%
--- Percent of households spending >30% of income on housing: 27.0%
- Total occupied households: 44,436
- Median household income: $88,628
- Median monthly housing cost: $1,527
#43. Staunton city
- Median percent of income spent on housing: 20.8%
--- Percent of households spending <20% of income on housing: 47.8%
--- Percent of households spending >30% of income on housing: 29.1%
- Total occupied households: 10,597
- Median household income: $52,611
- Median monthly housing cost: $910
#42. Prince George County
- Median percent of income spent on housing: 20.8%
--- Percent of households spending <20% of income on housing: 47.5%
--- Percent of households spending >30% of income on housing: 27.2%
- Total occupied households: 11,507
- Median household income: $71,912
- Median monthly housing cost: $1,247
#41. Henrico County
- Median percent of income spent on housing: 21.1%
--- Percent of households spending <20% of income on housing: 44.8%
--- Percent of households spending >30% of income on housing: 30.4%
- Total occupied households: 128,464
- Median household income: $70,307
- Median monthly housing cost: $1,236
You may also like: Highest-rated specialty museums in Virginia, according to Tripadvisor
#40. Arlington County
- Median percent of income spent on housing: 21.2%
--- Percent of households spending <20% of income on housing: 41.6%
--- Percent of households spending >30% of income on housing: 29.4%
- Total occupied households: 107,032
- Median household income: $120,071
- Median monthly housing cost: $2,118
#39. Lexington city
- Median percent of income spent on housing: 21.2%
--- Percent of households spending <20% of income on housing: 42.8%
--- Percent of households spending >30% of income on housing: 34.2%
- Total occupied households: 2,158
- Median household income: $42,632
- Median monthly housing cost: $754
#38. Cumberland County
- Median percent of income spent on housing: 21.3%
--- Percent of households spending <20% of income on housing: 44.4%
--- Percent of households spending >30% of income on housing: 31.3%
- Total occupied households: 3,975
- Median household income: $47,469
- Median monthly housing cost: $843
#37. Bristol city
- Median percent of income spent on housing: 21.4%
--- Percent of households spending <20% of income on housing: 45.8%
--- Percent of households spending >30% of income on housing: 29.4%
- Total occupied households: 7,334
- Median household income: $37,500
- Median monthly housing cost: $668
#36. Prince William County
- Median percent of income spent on housing: 21.5%
--- Percent of households spending <20% of income on housing: 41.5%
--- Percent of households spending >30% of income on housing: 30.7%
- Total occupied households: 142,000
- Median household income: $107,132
- Median monthly housing cost: $1,918
You may also like: Best places to retire in Virginia
#35. Falls Church city
- Median percent of income spent on housing: 21.6%
--- Percent of households spending <20% of income on housing: 42.1%
--- Percent of households spending >30% of income on housing: 34.1%
- Total occupied households: 5,493
- Median household income: $127,610
- Median monthly housing cost: $2,298
#34. Madison County
- Median percent of income spent on housing: 21.7%
--- Percent of households spending <20% of income on housing: 44.0%
--- Percent of households spending >30% of income on housing: 30.0%
- Total occupied households: 4,949
- Median household income: $57,895
- Median monthly housing cost: $1,045
#33. Danville city
- Median percent of income spent on housing: 21.7%
--- Percent of households spending <20% of income on housing: 44.1%
--- Percent of households spending >30% of income on housing: 32.6%
- Total occupied households: 18,293
- Median household income: $37,203
- Median monthly housing cost: $672
#32. Greene County
- Median percent of income spent on housing: 22.1%
--- Percent of households spending <20% of income on housing: 45.2%
--- Percent of households spending >30% of income on housing: 21.1%
- Total occupied households: 7,548
- Median household income: $67,398
- Median monthly housing cost: $1,241
#31. Fairfax city
- Median percent of income spent on housing: 22.1%
--- Percent of households spending <20% of income on housing: 42.3%
--- Percent of households spending >30% of income on housing: 27.8%
- Total occupied households: 8,577
- Median household income: $116,979
- Median monthly housing cost: $2,155
You may also like: Biggest sources of immigrants to Virginia
#30. Lynchburg city
- Median percent of income spent on housing: 22.1%
--- Percent of households spending <20% of income on housing: 44.3%
--- Percent of households spending >30% of income on housing: 33.1%
- Total occupied households: 28,273
- Median household income: $46,409
- Median monthly housing cost: $856
#29. Caroline County
- Median percent of income spent on housing: 22.2%
--- Percent of households spending <20% of income on housing: 47.0%
--- Percent of households spending >30% of income on housing: 28.5%
- Total occupied households: 10,946
- Median household income: $65,103
- Median monthly housing cost: $1,202
#28. Winchester city
- Median percent of income spent on housing: 22.2%
--- Percent of households spending <20% of income on housing: 43.3%
--- Percent of households spending >30% of income on housing: 33.6%
- Total occupied households: 10,490
- Median household income: $58,818
- Median monthly housing cost: $1,086
#27. Westmoreland County
- Median percent of income spent on housing: 22.2%
--- Percent of households spending <20% of income on housing: 44.7%
--- Percent of households spending >30% of income on housing: 33.4%
- Total occupied households: 7,923
- Median household income: $53,853
- Median monthly housing cost: $996
#26. Suffolk city
- Median percent of income spent on housing: 22.3%
--- Percent of households spending <20% of income on housing: 40.3%
--- Percent of households spending >30% of income on housing: 33.1%
- Total occupied households: 33,774
- Median household income: $74,884
- Median monthly housing cost: $1,392
You may also like: Highest-rated Class of 2021 football recruits from Virginia
#25. Alexandria city
- Median percent of income spent on housing: 22.4%
--- Percent of households spending <20% of income on housing: 37.0%
--- Percent of households spending >30% of income on housing: 32.6%
- Total occupied households: 70,598
- Median household income: $100,939
- Median monthly housing cost: $1,880
#24. Chesapeake city
- Median percent of income spent on housing: 22.4%
--- Percent of households spending <20% of income on housing: 39.6%
--- Percent of households spending >30% of income on housing: 32.1%
- Total occupied households: 84,849
- Median household income: $78,640
- Median monthly housing cost: $1,469
#23. Colonial Heights city
- Median percent of income spent on housing: 22.5%
--- Percent of households spending <20% of income on housing: 41.9%
--- Percent of households spending >30% of income on housing: 35.3%
- Total occupied households: 7,036
- Median household income: $54,550
- Median monthly housing cost: $1,021
#22. Virginia Beach city
- Median percent of income spent on housing: 22.9%
--- Percent of households spending <20% of income on housing: 37.9%
--- Percent of households spending >30% of income on housing: 34.1%
- Total occupied households: 170,798
- Median household income: $76,610
- Median monthly housing cost: $1,463
#21. Roanoke city
- Median percent of income spent on housing: 23.0%
--- Percent of households spending <20% of income on housing: 40.4%
--- Percent of households spending >30% of income on housing: 36.6%
- Total occupied households: 41,740
- Median household income: $44,230
- Median monthly housing cost: $847
You may also like: Best counties to raise a family in Virginia
#20. Martinsville city
- Median percent of income spent on housing: 23.2%
--- Percent of households spending <20% of income on housing: 43.3%
--- Percent of households spending >30% of income on housing: 33.5%
- Total occupied households: 5,532
- Median household income: $34,371
- Median monthly housing cost: $665
#19. Harrisonburg city
- Median percent of income spent on housing: 23.7%
--- Percent of households spending <20% of income on housing: 38.2%
--- Percent of households spending >30% of income on housing: 35.6%
- Total occupied households: 16,723
- Median household income: $46,679
- Median monthly housing cost: $920
#18. Charlottesville city
- Median percent of income spent on housing: 24.0%
--- Percent of households spending <20% of income on housing: 41.4%
--- Percent of households spending >30% of income on housing: 36.3%
- Total occupied households: 18,617
- Median household income: $59,471
- Median monthly housing cost: $1,189
#17. Fredericksburg city
- Median percent of income spent on housing: 24.1%
--- Percent of households spending <20% of income on housing: 38.5%
--- Percent of households spending >30% of income on housing: 37.1%
- Total occupied households: 10,762
- Median household income: $65,641
- Median monthly housing cost: $1,320
#16. Williamsburg city
- Median percent of income spent on housing: 24.3%
--- Percent of households spending <20% of income on housing: 40.7%
--- Percent of households spending >30% of income on housing: 33.8%
- Total occupied households: 4,706
- Median household income: $57,463
- Median monthly housing cost: $1,164
You may also like: Do you know Virginia's official state symbols?
#15. Manassas city
- Median percent of income spent on housing: 24.5%
--- Percent of households spending <20% of income on housing: 34.4%
--- Percent of households spending >30% of income on housing: 37.3%
- Total occupied households: 12,898
- Median household income: $81,493
- Median monthly housing cost: $1,662
#14. Hampton city
- Median percent of income spent on housing: 24.9%
--- Percent of households spending <20% of income on housing: 36.7%
--- Percent of households spending >30% of income on housing: 36.9%
- Total occupied households: 54,050
- Median household income: $56,287
- Median monthly housing cost: $1,166
#13. Waynesboro city
- Median percent of income spent on housing: 25.0%
--- Percent of households spending <20% of income on housing: 41.2%
--- Percent of households spending >30% of income on housing: 31.5%
- Total occupied households: 9,193
- Median household income: $45,011
- Median monthly housing cost: $937
#12. Norton city
- Median percent of income spent on housing: 25.1%
--- Percent of households spending <20% of income on housing: 49.7%
--- Percent of households spending >30% of income on housing: 31.6%
- Total occupied households: 1,628
- Median household income: $29,000
- Median monthly housing cost: $607
#11. Manassas Park city
- Median percent of income spent on housing: 25.2%
--- Percent of households spending <20% of income on housing: 32.7%
--- Percent of households spending >30% of income on housing: 37.2%
- Total occupied households: 4,641
- Median household income: $88,046
- Median monthly housing cost: $1,846
You may also like: States sending the most people to Virginia
#10. Newport News city
- Median percent of income spent on housing: 25.2%
--- Percent of households spending <20% of income on housing: 34.5%
--- Percent of households spending >30% of income on housing: 39.0%
- Total occupied households: 69,835
- Median household income: $53,215
- Median monthly housing cost: $1,117
#9. Franklin city
- Median percent of income spent on housing: 25.7%
--- Percent of households spending <20% of income on housing: 34.9%
--- Percent of households spending >30% of income on housing: 37.0%
- Total occupied households: 3,522
- Median household income: $40,417
- Median monthly housing cost: $864
#8. Portsmouth city
- Median percent of income spent on housing: 25.9%
--- Percent of households spending <20% of income on housing: 32.6%
--- Percent of households spending >30% of income on housing: 39.0%
- Total occupied households: 36,370
- Median household income: $52,175
- Median monthly housing cost: $1,124
#7. Norfolk city
- Median percent of income spent on housing: 26.8%
--- Percent of households spending <20% of income on housing: 31.2%
--- Percent of households spending >30% of income on housing: 40.9%
- Total occupied households: 88,353
- Median household income: $51,590
- Median monthly housing cost: $1,153
#6. Hopewell city
- Median percent of income spent on housing: 26.8%
--- Percent of households spending <20% of income on housing: 40.9%
--- Percent of households spending >30% of income on housing: 36.6%
- Total occupied households: 9,224
- Median household income: $39,030
- Median monthly housing cost: $873
You may also like: Recipes from Virginia
#5. Radford city
- Median percent of income spent on housing: 27.0%
--- Percent of households spending <20% of income on housing: 36.9%
--- Percent of households spending >30% of income on housing: 38.0%
- Total occupied households: 5,573
- Median household income: $36,297
- Median monthly housing cost: $818
#4. Richmond city
- Median percent of income spent on housing: 27.7%
--- Percent of households spending <20% of income on housing: 32.9%
--- Percent of households spending >30% of income on housing: 41.4%
- Total occupied households: 90,301
- Median household income: $47,250
- Median monthly housing cost: $1,092
#3. Buena Vista city
- Median percent of income spent on housing: 28.0%
--- Percent of households spending <20% of income on housing: 35.5%
--- Percent of households spending >30% of income on housing: 37.3%
- Total occupied households: 2,517
- Median household income: $32,455
- Median monthly housing cost: $758
#2. Petersburg city
- Median percent of income spent on housing: 29.2%
--- Percent of households spending <20% of income on housing: 30.8%
--- Percent of households spending >30% of income on housing: 43.9%
- Total occupied households: 13,165
- Median household income: $38,679
- Median monthly housing cost: $941
#1. Emporia city
- Median percent of income spent on housing: 32.4%
--- Percent of households spending <20% of income on housing: 30.5%
--- Percent of households spending >30% of income on housing: 45.1%
- Total occupied households: 2,086
- Median household income: $27,063
- Median monthly housing cost: $730
You may also like: Counties with the worst commutes in Virginia


