The cost of gasoline the year you started driving
The cost of gasoline the year you started driving
Gas prices in the U.S. have fluctuated significantly in recent years, shooting up to a record-setting national average of $5.02 per gallon in June 2022 before declining in the summer of 2023. Prices eventually went down to around $3 per gallon in late 2024, but have shot up again more recently—as of March 2026, the national average price is hovering at $3.58 a gallon, according to AAA.
To illustrate how fuel prices have changed throughout the years and why, Stacker ran the numbers on the cost of a gallon of gasoline for each of the last 85 years. Using data from the Bureau of Labor Statistics (last updated in August 2021), we analyzed the average price for a gallon of unleaded regular gasoline from 1976 to 2021 along with the Consumer Price Index (CPI) for unleaded regular gasoline from 1937 to 1976, including the absolute and inflation-adjusted prices for each year.
For nearly every mile driven, American consumers find themselves inextricably linked to a complex global commodity that has a significant impact on how we get from place to place. Most of the time, the highs and the lows of gas prices are out of drivers' hands.
During the Arab-Israeli War in 1973, Arab oil manufacturers banned exports to the U.S. due to their support of Israel, leading to a gas shortage and sky-high prices. In recent years, an increase in demand for oil in developing economies alongside an expansion in production from countries (like the U.S.) that once imported most of their oil, led to a sharp drop in oil prices. In the early months of the COVID-19 pandemic, stay-at-home orders caused oil prices to crater as demand for oil bottomed out. Consumers may find themselves less directly affected by the price of a barrel of oil as hybrid and electric vehicles become more commonplace, public transit grows less gas-reliant, and the cost of switching to alternative energy sources at home comes down.
Keep reading to explore the cost of gas over time and rediscover just how much a gallon was when you first started driving.
1937
- Absolute gas price: $0.19
- Inflation-adjusted price: $3.60 (#10 most expensive year in 85-year span)
After President Franklin D. Roosevelt took office in 1933, the economic state of the country seemed hopeful: Americans were beginning to emerge from the financial wreckage of the Great Depression, and unemployment rates dropped more than 10% in just a few years. In 1937, the nation was hit by yet another period of economic downturn, during which unemployment spiked once more. A number of federal economic decisions, such as switching to a contractionary monetary policy, impacted inflation and led to relatively high gas prices.
1938
- Absolute gas price: $0.18
- Inflation-adjusted price: $3.49 (#13 most expensive year in 85-year span)
In an effort to protect smaller gas station operators from the aggressive pricing of bigger companies, the state of New Jersey instituted a law in 1938 that prevented gas stations from raising prices more than once a day. In 2005, this law was put to the test when civil action was taken against 20 gas stations for doing exactly that. 1938 also brought about a recovery of the economic downturn that had begun in 1937.
1939
- Absolute gas price: $0.17
- Inflation-adjusted price: $3.34 (#16 most expensive year in 85-year span)
1939 marked the official end of the Great Depression, and therefore the beginning of America's return to a more stable economy. This year also marked the beginning of World War II; entering the war two years later, though devastating, would greatly invigorate the American economy and workforce. Gas prices began to drop at this time, as the U.S. teetered on the edge of a period of revitalization.
1940
- Absolute gas price: $0.16
- Inflation-adjusted price: $3.12 (#20 most expensive year in 85-year span)
In 1940, development in the world of automobiles changed the American car permanently: The Oldsmobile became the first car to offer the Hydra-matic, at an additional cost of $57, illustrating a move away from manual driving. This early version of an automatic car offered no setting for "park"; instead, the driver was supposed to put the car in reverse and then turn it off. Gas prices fell again this year, fairly substantially, and though the U.S. had not yet joined World War II, the nation was in a period of rearmament and providing aid to Great Britain.
1941
- Absolute gas price: $0.17
- Inflation-adjusted price: $3.16 (#19 most expensive year in 85-year span)
Between 1940 and 1941, absolute gas prices rose by a cent, but inflation-adjusted prices dropped by 2 cents. This is due to the fact that at this moment in history, inflation was rising faster than actual prices; in fact, the inflation rate in 1941 was nearly 10%. At the tail end of the year, the United States finally entered World War II, thereby igniting a shift in global politics and economics.
1942
- Absolute gas price: $0.18
- Inflation-adjusted price: $3.01 (#23 most expensive year in 85-year span)
The United States was now a player in World War II, which meant the introduction of gas rationing. Gas rationing had little to do with a shortage; what the United States armed forces needed was rubber, so nonessential rubber usage (like car tires) had to go. In order to stop people from wearing out their tires and needing rubber that could have gone to military efforts, the U.S. decided to ration gas, limiting the number of gallons various driver classes could purchase per week.
1943
- Absolute gas price: $0.19
- Inflation-adjusted price: $3.00 (#26 most expensive year in 85-year span)
While World War II succeeded in reinvigorating the American economy, it also brought multiple industries to a complete stop. Over the course of the war, only 139 cars were produced in the United States. Instead of making cars, key players like Chrysler and General Motors were busy producing things like guns, tanks, and aircraft components. Therefore, the gas prices in 1943 applied only to American-made cars that were already in existence, as getting a new domestically produced set of wheels at this time was not an option.
1944
- Absolute gas price: $0.19
- Inflation-adjusted price: $2.95 (#33 most expensive year in 85-year span)
Between 1943 and 1944, though the absolute price of gas remained steady at $0.19 a gallon, the inflation-adjusted price dropped by several cents. This has to do with a strengthening American economic state: the war necessitated such a high degree of productivity that real wages rose by 50% between 1939 and 1944, allowing Americans to save and spend more. The war created new industries, pulled women and African Americans into the workforce, increased overtime pay, and encouraged Americans to participate in their own economy from an ideological standpoint.
1945
- Absolute gas price: $0.19
- Inflation-adjusted price: $2.88 (#39 most expensive year in 85-year span)
After years of conflict and a global loss of 70 to 85 million lives, World War II came to an end. Consequently, the end of the war also brought about the end of gas rationing in August of 1945, as well as the removal of limitations on automobile production. Many automobile companies announced plans to expand their facilities, and begin producing at rates far higher than before the war in order to meet the pent-up demand of American consumers.
1946
- Absolute gas price: $0.19
- Inflation-adjusted price: $2.66 (#26 least expensive year in 85-year span)
The postwar era brought both relief and complications for the automobile industry. Big names were ready to return to production and capitalize on an American public that suddenly had money to spend, but workers were also demanding more rights; an early 1946 steelworker strike brought production to a halt. Once matters were resolved (steel companies settled after pressure from President Harry Truman), cars began to roll out, including new models from Ford and a Chrysler convertible.
1947
- Absolute gas price: $0.21
- Inflation-adjusted price: $2.57 (#25 least expensive year in 85-year span)
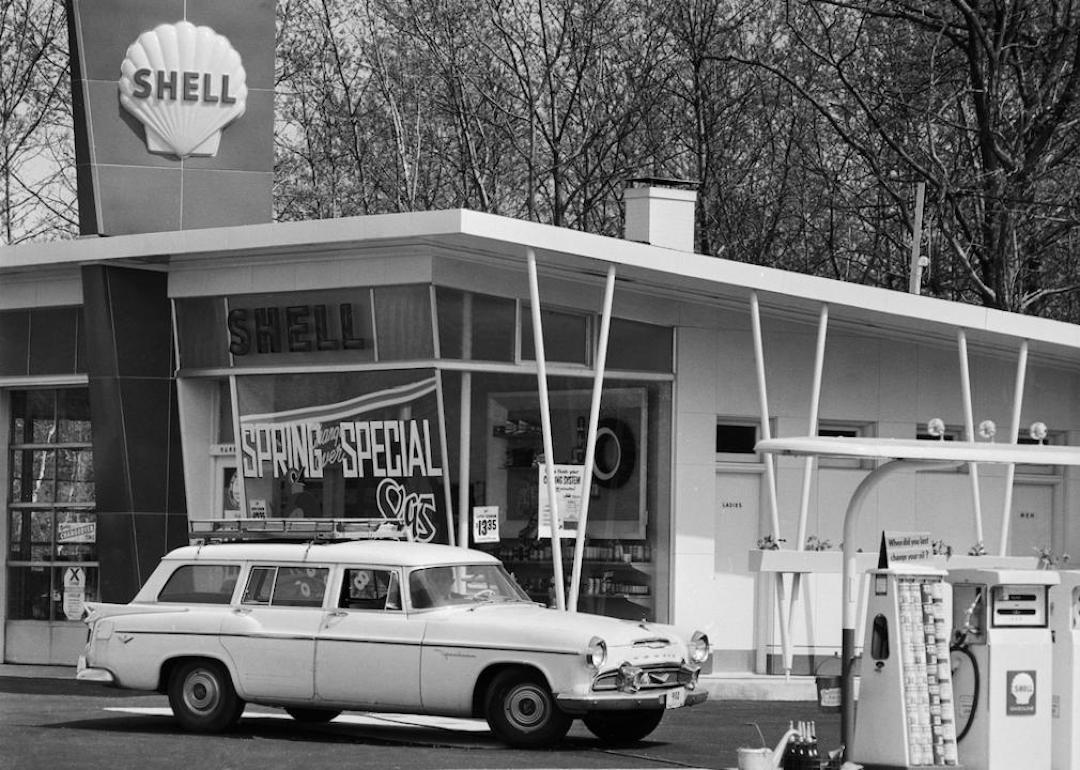
Today, full-service gas stations have largely gone the way of drive-in movie theatres and travel agents: While they're not entirely gone, pumping your own gas is certainly a more common practice. The slow death of full-service gas stations began in 1947 when Los Angeles gas station operator Frank Ulrich advertised cheaper prices in exchange for customers pumping their own gas. It was a hit, with the tiny station selling hundreds of thousands of gallons in a single month. Within a few decades, self-serve gas was commonplace across the nation.
1948
- Absolute gas price: $0.24
- Inflation-adjusted price: $2.72 (#31 least expensive year in 85-year span)
1948 marked a monumental discovery in the world of oil, which would impact the ways in which the U.S. and the world received crude oil. In the early 1940s, American geologists working for Standard Oil of California were searching for oil in Saudi Arabia. They discovered a geological bend in a riverbed that indicated an underlying oil field. Further exploration was put on pause during the war, but in 1948, a test drill hit oil. This was the beginning of a series of discoveries about the Ghawar Field, which would turn out to be the largest oil field in the world.
1949
- Absolute gas price: $0.25
- Inflation-adjusted price: $2.87 (#40 most expensive year in 85-year span)
Petroleum, also known as crude oil, was found in underground reservoirs and used to make gasoline, and therefore the global price of crude oil began to directly impact the cost of gas. The United States both imported and exported petroleum, though for many years the nation imported far more than it exported. In 1949, the United States exported more petroleum products than it imported, making it a net exporter—something that didn't happen again until 2011.
1950
- Absolute gas price: $0.25
- Inflation-adjusted price: $2.83 (#39 least expensive year in 85-year span)
The 1950s may conjure images of sock hops and "Leave It To Beaver"-esque viewing material, but nothing defines this decade more than its cars. In 1950, the automobile industry produced nearly 8 million vehicles and capitalized on popular features like the hardtop convertible. The automatic transmission also continued to grow in popularity, with an estimated 1.5 million automatic units sold in 1950.
1951
- Absolute gas price: $0.26
- Inflation-adjusted price: $2.73 (#32 least expensive year in 85-year span)
American gas and consumption reached an all-time high in 1951: The per capita consumption of gasoline was 295 gallons, and U.S. oil production hit 6.2 million barrels a day. While Americans consumed more oil, the U.S. did not always increase its production rate. In 2000, for example, oil production dropped to 5.8 million barrels a day. It would eventually rise again, and in May 2019, the United States hit a crude oil production average of more than 12 million barrels per day.
1952
- Absolute gas price: $0.26
- Inflation-adjusted price: $2.68 (#28 least expensive year in 85-year span)
In the 1950s, competition in gasoline retailing became an issue. Competitors would constantly drop prices in order to remain appealing to customers, winning over potential buyers with the promise of freebies, like car accessories. In Philadelphia, concern over the practice of competitive pricing reached such a scale that a faction of retail dealers asked the governor to look into some retailers' dishonest practices and initiate preventative legislation.
1953
- Absolute gas price: $0.28
- Inflation-adjusted price: $2.86 (#42 most expensive year in 85-year span)
The national average gas price in 1953 may have been $0.28 a gallon, but for those looking for a bargain, Omaha, Nebraska, was the place to be. Omaha native Lynn Folgate remembered getting gas that year (her first year driving) for the low price of $0.18 a gallon, according to recollections shared with the Rockford Register Star. Folgate also recalled that during her years as a "pump jockey," people often purchased gas by demanding a specific gallon amount, rather than a dollar amount, perhaps as a relic from years of gas rationing.
1954
- Absolute gas price: $0.28
- Inflation-adjusted price: $2.84 (#40 least expensive year in 85-year span)
The U.S. experienced a slight recession between 1953 and 1954. In the wake of the Korean War, actions taken by the Federal Reserve and Treasury caused a rise in interest rates, leading to general pessimism toward the American economy. This brought upon a decrease in aggregate demand (the total demand for goods and services within the economy) and set in motion a three-quarter economic decline. Though the absolute gas price remained steady from 1953 to 1954, consumers overall spent less money during this time, and the GDP contracted 1.9% in the first quarter of 1954.
1955
- Absolute gas price: $0.29
- Inflation-adjusted price: $2.95 (#31 most expensive year in 85-year span)
Smack in the middle of a thriving economy, and with more and more people relocating to the suburbs as a result of the baby boom, 1955 was a particularly fruitful year for the automotive industry. Automobile manufacturers were experimenting with style and substance, introducing new technology in impressive designs. One of the most significant cars from this year was the Chevrolet Bel-Air, from Chevrolet's three "Tri-Five" series.
1956
- Absolute gas price: $0.30
- Inflation-adjusted price: $3.01 (#25 most expensive year in 85-year span)
In 1956, inflation-adjusted gas prices and absolute gas prices increased slightly from the previous year. As more people began living in suburbs outside of centralized industrial hubs, Americans began using more fuel—between 1955 and 1956, the average gallons per vehicle jumped from 761 to 771, according to data from the U.S. Energy Information Administration. Americans were also beginning to get fewer miles per gallon, meaning they were likely spending more on gas overall.
1957
- Absolute gas price: $0.31
- Inflation-adjusted price: $3.01 (#24 most expensive year in 85-year span)
The federal gasoline tax has remained at 18.4% since 1993 and exists with the intention of raising money to pay for infrastructure like roads and highways. The current structure of this tax dates back to 1957, when a system was set up to send all money made from the gasoline tax directly to the federal Highway Trust Fund. The general public expressed support for the idea of this tax being spent on things that would help them navigate their cities. Since then, that cash supply has been put toward other projects.
1958
- Absolute gas price: $0.31
- Inflation-adjusted price: $2.93 (#34 most expensive year in 85-year span)
The 1958 recession signaled the sharpest economic downturn during the generally prosperous era between World War II and the 1970s. Many industries were deeply affected during this time, with the automobile industry as a prime example. 1958 was the worst year for automotive workers since the industry-wide wartime halt a decade earlier. This period of economic distress lasted less than a year, but impacted unemployment, spending, and the strength of the dollar.
1959
- Absolute gas price: $0.31
- Inflation-adjusted price: $2.91 (#37 most expensive year in 85-year span)
There was a shift in America's attitude toward oil at this time. President Dwight Eisenhower introduced the Mandatory Oil Import Program, placing restrictions on the amount of oil that could be imported into the United States. His reasoning was based on national security concerns and a desire to prevent America from becoming too reliant on other nations for energy.
1960
- Absolute gas price: $0.32
- Inflation-adjusted price: $2.95 (#32 most expensive year in 85-year span)
Throughout the 1960s, new cars continued to blend exciting new technology with increasingly sleek design. Style was moving away from the 1950s "bigger is better" mentality, and toward a pared-down but intensely powerful world of automobiles. Muscle cars, which originated in this decade, are a perfect example of this new ideal. Additionally, 1960 marked the founding year of OPEC (the Organization of the Petroleum Exporting Countries), made up of the world's biggest oil producers. This force exerted its power over oil and gasoline prices for the United States and the rest of the world.
1961
- Absolute gas price: $0.32
- Inflation-adjusted price: $2.92 (#36 most expensive year in 85-year span)
In January 1961, John F. Kennedy took office as the 35th president of the United States. This marked the tail-end of a short recession, which led to a period of immense economic expansion (the longest in history up to that point), lasting until 1969. Some cars that were introduced in 1960 include the Mazda B Series, the Fiat 2300, and the Oldsmobile Cutlass.
1962
- Absolute gas price: $0.32
- Inflation-adjusted price: $2.89 (#38 most expensive year in 85-year span)
There was no change in the absolute price of gas between 1961 and 1962, and the inflation-adjusted price dropped by just by two cents. The world was shaken on Nov. 22, 1963, when President Kennedy was assassinated during a presidential motorcade in Dallas, Texas. Though experts agree that Kennedy's economic legacy is complicated—his tax cuts remain a popular point of discussion on that front—he certainly presided over a period of immense economic prosperity in the United States, leading to low unemployment rates even after his death.
1963
- Absolute gas price: $0.32
- Inflation-adjusted price: $2.85 (#41 least expensive year in 85-year span)
The 1960s were not necessarily a time of great environmental concern or awareness, but Americans were starting to take notice of factories and cars negatively impacting air quality. In 1963, the Clean Air Act was officially passed. This legislation allowed for the creation of a program that researched methods of controlling air pollution, in an attempt to control current levels.
1964
- Absolute gas price: $0.32
- Inflation-adjusted price: $2.82 (#35 least expensive year in 85-year span)
In 1964, the median income for American families was $6,600 a year. This marked a strong year for consumers—this median income was 5% higher than it had been in 1963, and more than double what it had been in 1947. Absolute gas prices once again remained steady at $0.32 per gallon, meaning that at this time, a gallon of gas made up a slightly smaller percentage of a person's total income than it did in 2018.
1965
- Absolute gas price: $0.33
- Inflation-adjusted price: $2.86 (#42 least expensive year in 85-year span)
The Clean Air Act of 1963 was an important move in the direction of environmental awareness, and the 1965 amendments to this law specifically targeted automobile emissions. The amendments, known as the Motor Vehicle Air Pollution Control Act, prioritized setting specific standards for car emissions, beginning with 1968 car models. The amendments also raised awareness and promoted research on how pollution in the United States could impact air quality in Mexico and Canada.
1966
- Absolute gas price: $0.34
- Inflation-adjusted price: $2.86 (#41 most expensive year in 85-year span)
Few cars can sum up the automobile style preferences of the 1960s like the Ford Mustang. Beginning with the Mustang I, a two-seater that prioritized style over substance, the car eventually morphed into its 1966 identity: often a red convertible with all the flair of the popular muscle car ideal. In 1966, Ford sold approximately 500,000 Mustangs Coupes, making it one of the most popular and lasting models the brand ever produced.
1967
- Absolute gas price: $0.35
- Inflation-adjusted price: $2.86 (#43 most expensive year in 85-year span)
In 1967, the United States was in the midst of the Vietnam War. By this point, the U.S. troop count in Vietnam was nearing half a million, casualties were rising on both sides, and American anti-war sentiments were becoming increasingly prevalent. Elsewhere in the world, the scene was being set for the 1973 oil crisis, during which gas shortages plagued America, as major global oil suppliers like Saudi Arabia, Iraq, and Kuwait temporarily banned shipments. This came in response to the Six-Day War between Israel and Egypt, Syria, and Jordan, which occurred in 1967. Use of oil as a tactical playing card in this way is referred to as the "oil" weapon.
1968
- Absolute gas price: $0.35
- Inflation-adjusted price: $2.75 (#33 least expensive year in 85-year span)
There might be no more picturesque image than sitting behind the wheel of a Mustang California Special, driving up the Pacific Coast Highway with the wind in your hair, perhaps on your way to grab a 50-cent hamburger—because it's 1968. The Ford Mustang California Special coupe was produced in a limited run (only about 4,000 were sold) and sold primarily in California in the 1968 auto year. This car is a strong example of 1960s style and the West Coast glamour that was idealized at the time.
1969
- Absolute gas price: $0.36
- Inflation-adjusted price: $2.68 (#27 least expensive year in 85-year span)
At the end of Richard Nixon's first year as president in December of 1969, unemployment had fallen to 3.5% (a low that has yet to be matched), and inflation was at 6.2%. Because of this, prices generally rose, even as overall spending remained about the same. This may have contributed to gas prices rising a cent from 1968, from $0.35 to $0.36 per gallon.
1970
- Absolute gas price: $0.36
- Inflation-adjusted price: $2.53 (#24 least expensive year in 85-year span)
Despite past political efforts, by the early 1970s the United States had developed a reliance on imported oil. Technological advances meant that more oil and gasoline than ever before was required to maintain daily life, but the U.S. was producing less and less oil domestically. This would ultimately develop into the 1973 oil crisis. The economy also took an overall hit this year—GDP growth was only 0.2%, down a substantial amount from the year prior, and inflation continued.
1971
- Absolute gas price: $0.37
- Inflation-adjusted price: $2.49 (#22 least expensive year in 85-year span)
Gas prices climbed in 1971, as did taxes, due to inflation and general economic instability. The situation became so dire that President Richard Nixon issued a 90-day freeze on all prices and wages in the nation. He demanded that everyone, from the individual to the corporation, cooperate voluntarily. The freeze brought about mixed reactions, and though it did initially inject some much-needed life back into the stock market, the success was short-lived.
1972
- Absolute gas price: $0.37
- Inflation-adjusted price: $2.42 (#19 least expensive year in 85-year span)
The 1973 gas crisis caused widespread panic and national gasoline shortages. This event caught most by surprise, but not Stewart Udall, a writer for The Atlantic who predicted the crisis in 1972. Udall was convinced that insufficient American oil production, coupled with an unstable market in the Middle East would prove problematic, and wrote that "the impact of these tremors can already be anticipated."
1973
- Absolute gas price: $0.41
- Inflation-adjusted price: $2.52 (#23 least expensive year in 85-year span)
The most famous historic event to do with gasoline and gas prices, the 1973 oil crisis began when the members of OPEC declared an embargo against nations that had supported, or appeared to support, Israel during the Arab-Israeli war earlier that year. This embargo meant that the United States, which had become extremely reliant on foreign oil, suddenly faced gasoline shortages. In response, gas prices soared, and lines at gas stations got longer. The impact of this crisis ultimately stretched far beyond availability; in fact, the crisis shifted the balance of global politics and forced America to take a position in the Middle East in order to end the embargo.
1974
- Absolute gas price: $0.55
- Inflation-adjusted price: $3.05 (#21 most expensive year in 85-year span)
When 1974 began, the United States was still very much in the midst of the oil crisis that had begun the previous year as retaliation against nations that OPEC believed supported Israel. This was accompanied by a stock market crash that lasted throughout 1973 and 1974, and gas prices continued to skyrocket. In some states, license plates ending with odd or even numbers could fill up only on certain days. Eventually, negotiations resulted in Israel withdrawing its troops from the Suez Canal in exchange for lifting the embargo.
1975
- Absolute gas price: $0.59
- Inflation-adjusted price: $2.99 (#27 most expensive year in 85-year span)
By 1975, the public was scared and suspicious; two years of waking up at the crack of dawn to wait in line for gasoline had taken its toll on morale, and gas prices increased once again. Along with changes in price, however, came changes with how money was spent. Throughout the 1970s, the credit card was gaining popularity, and women were beginning to demand equal rights in the realm of credit and finances. In fact, a year after the Senate passed the Equal Credit Opportunity Act, a bank opened that was geared specifically toward women.
1976
- Absolute gas price: $0.61
- Inflation-adjusted price: $2.93 (#35 most expensive year in 85-year span)
Absolute gas prices rose by two cents between 1975 and 1976, though inflation began to slow down around this time. The inflation adjusted price dropped by five cents between the two years. Though the oil embargo that had caused gasoline shortages had been lifted, the United States now faced another energy crisis: a natural gas shortage that resulted in layoffs in the automobile industry. Businesses and homeowners alike struggled to function and stay warm as winter approached.
1977
- Absolute gas price: $0.66
- Inflation-adjusted price: $2.97 (#30 most expensive year in 85-year span)
Unemployment in 1976 had reached 7.7%, and President Jimmy Carter inherited a nation that was still in recovery from years of oil shortages, inflation, and general economic instability. Gas prices jumped up again this year, from $0.61 in 1976 to $0.66 in 1977, but the economy did prosper during Carter's first year in office, and unemployment rates fell for the two ensuing years.
1978
- Absolute gas price: $0.67
- Inflation-adjusted price: $2.81 (#34 least expensive year in 85-year span)
Just a few years after the 1973 oil shock, a second crisis reared its head. Consumer inflation was steadily increasing, and though the Federal Reserve tried to combat this issue, it proved ineffective—prices were about to jump once more. The worst of the crisis would occur the following year, and the beginning of the Iranian Revolution helped set the stage.
1979
- Absolute gas price: $0.90
- Inflation-adjusted price: $3.38 (#15 most expensive year in 85-year span)
The Iranian Revolution began in January 1978, disrupting the country's oil exportation process. Availability dropped as a consequence, but in reality, Iranian oil exportation only dropped by a small percentage. Nevertheless, the panic was enough to send gas prices around the globe skyrocketing once again. America was, for the second time in a decade, faced with high prices, long waits at the gas station, and extreme inflation. In November, the global situation worsened as the 444-day Iranian hostage crisis began.
1980
- Absolute gas price: $1.25
- Inflation-adjusted price: $4.14 (#5 most expensive year in 85-year span)
After the oil crisis of 1979, gas prices surged once more in 1980, jumping from $0.90 to $1.25 per gallon as global oil prices peaked. Jimmy Carter's presidency was marked by inflation, gas shortages, and international crises, and despite his 1979 "crisis of confidence" speech, Carter was defeated by Ronald Reagan.
1981
- Absolute gas price: $1.38
- Inflation-adjusted price: $4.14 (#4 most expensive year in 85-year span)
In 1981, the oil and gasoline panic gave way to a glut, though as New York Times writer Daniel Yergin cautioned, the idea of a "glut" was a "dangerous and costly illusion." There wasn't more oil, simply a change in demand for the product. High prices meant that demand and consumer interest had fallen, and this lack of demand created a global surplus in the oil market. Additionally, the Reagan administration effectively deregulated the oil market. Suppliers were suddenly more eager to sell, as higher interest rates increased the cost of keeping large amounts of stock. Though prices rose again in 1981, they were moving closer to pre-crisis numbers.
1982
- Absolute gas price: $1.30
- Inflation-adjusted price: $3.68 (#9 most expensive year in 85-year span)
The automobile industry struggled throughout the 1980s, and one unlucky victim of this hardship was the DeLorean. Made iconic by its role in the "Back to the Future" franchise, the Delorean was already famous due to the lavish legacy of its founder, John Z. DeLorean. In October 1982, however, DeLorean shuttered its doors. Perhaps the option of a 24-karat gold-plated DeLorean, retailing at $85,000, simply didn't have enough mass-market appeal.
1983
- Absolute gas price: $1.24
- Inflation-adjusted price: $3.40 (#14 most expensive year in 85-year span)
Gas prices still hovered at levels far above their pre-crisis numbers in 1983. Just five years prior, gas was $0.67, almost half the price in 1983. The "oil glut" of the 1980s was causing prices to drop to the point where major oil suppliers marked down their crude oil to as little as $5 a barrel. This came in sharp contrast to the globally jacked-up oil prices of just a few years prior, but since demand for gasoline had fallen so sharply, oil suppliers were forced to slash prices.
1984
- Absolute gas price: $1.21
- Inflation-adjusted price: $3.18 (#18 most expensive year in 85-year span)
Between the 1960s and the 1980s, global awareness of the fossil fuel industry's impact on the environment grew rapidly. A 1969 oil spill off the coast of Santa Barbara garnered public condemnation of offshore drilling, and in the early '80s, Congress banned new offshore drilling in most parts of the country's coastal waters. However, offshore drilling continues in areas of the Gulf of Mexico, and as regulations shift, this practice makes up a higher and higher percentage of the United States' total oil production.
1985
- Absolute gas price: $1.20
- Inflation-adjusted price: $3.04 (#22 most expensive year in 85-year span)
As environmental awareness and concern began to take root, the government turned its attention toward the automobile industry with regard to fuel economy standards. In 1975, Congress introduced the Energy Policy and Conservation Act, which set standards intended to double the average car's fuel economy by model year 1985. As a result, the average mileage in a passenger vehicle jumped from 13.5 miles per gallon in 1975 to 27.5 miles per gallon a decade later. Light truck fuel economy also increased, and many Americans paid less for gas in total (even though prices per gallon were still fairly high at $1.20).
1986
- Absolute gas price: $0.93
- Inflation-adjusted price: $2.32 (#16 least expensive year in 85-year span)
Oil prices collapsed in 1986, as Saudi Arabia changed course in its approach to the oil market. Rather than drumming up prices as it had in the past, it increased production in an attempt to dominate its share of the global market. Oil prices were plummeting and gas prices dropped 27 cents from the year prior, with a sweeping impact on the American economy and job market. The oil and gas extraction industry lost 150,000 jobs over the course of the year.
1987
- Absolute gas price: $0.95
- Inflation-adjusted price: $2.28 (#13 least expensive year in 85-year span)
Heading into 1987, many feared lasting damage as a result of the oil price collapse. However, in December 1986, several OPEC members agreed to cut production, thereby raising prices. The cuts would bring OPEC oil prices up to $18 per barrel, and in 1987, gas prices began to stabilize. OPEC had previously used a fixed-price system of this kind, the abandonment of which had been an attempt to dominate the world market, but led to plummeting gas prices.
1988
- Absolute gas price: $0.95
- Inflation-adjusted price: $2.19 (#9 least expensive year in 85-year span)
In 1988, OPEC leaders met once again to discuss oil production limits, which had previously been established as 16.6 million barrels per day. Bringing production down to this level was intended to raise prices globally and meet a benchmark oil price of $18 per barrel. With these cuts and limitations in place, gasoline prices in 1988 matched those of 1987, signaling that the falling prices had come to an end.
1989
- Absolute gas price: $1.02
- Inflation-adjusted price: $2.25 (#11 least expensive year in 85-year span)
Though not exactly a time of prosperity for the automobile industry, 1989 brought about two important additions to the American world of cars. The Lexus LS 400, born from Japanese car giant Toyota, launched this year, and changed the world of luxury cars forever. On an episode of "Top Gear," the model was described as "petrifyingly good." This wasn't the only way in which Japan solidified itself as a key player in the American luxury car industry: Nissan also introduced the Infiniti this year
1990
- Absolute gas price: $1.16
- Inflation-adjusted price: $2.42 (#20 least expensive year in 85-year span)
The first federal gasoline tax, of $0.01 a gallon, was put into place in 1932. The gas tax was always intended to create revenue to be used toward new infrastructure, but in 1990, that changed. Congress approved a package in which the gas tax would be raised from $0.091 to $0.14 a gallon, but half of the additional revenue created would be put toward reducing the national deficit. Some experts believe this permanently altered public attitude toward the gas tax. Instead of seeing it as a necessary and even helpful price for maintaining roads, it had transformed into a federal cash pot.
1991
- Absolute gas price: $1.14
- Inflation-adjusted price: $2.29 (#14 least expensive year in 85-year span)
At the start of 1991, the United States was still in the midst of the Gulf War, which had begun in August 1990 when Saddam Hussein's forces invaded Kuwait. This Iraqi invasion caused a decrease in oil production, leading to a spike in oil prices keenly felt by a country in recession. The average price of gasoline in 1991 remained fairly inflated at $1.14 per gallon.
1992
- Absolute gas price: $1.13
- Inflation-adjusted price: $2.20 (#10 least expensive year in 85-year span)
In 1992, Bill Clinton defeated George H.W. Bush in the presidential election. A factor politicians often point to in terms of the victory was a rising unemployment rate. Though gas prices also spiked under Bush's watch, they were on the decline by the election. Clinton used the previous recession as a means for painting Bush's economic strategies as problematic, and famously had the phrase "the economy, stupid" scrawled on a campaign headquarters whiteboard as a reminder of how much Americans cared about this issue.
1993
- Absolute gas price: $1.11
- Inflation-adjusted price: $2.10 (#7 least expensive year in 85-year span)
Throughout 1992, 10 million Americans were unemployed, the poverty rate hit 15.1%, and inflation was still impacting family income. As a response, President Bill Clinton and Vice President Al Gore launched an economic strategy that slowly began to shift the economy forward. This strategy involved eliminating the deficit, prioritizing education as a means for creating American jobs, and opening foreign markets.
1994
- Absolute gas price: $1.11
- Inflation-adjusted price: $2.04 (#3 least expensive year in 85-year span)
Gas prices remained steady from 1993 to 1994, hovering at $1.11 per gallon. Some of the most popular cars for that model year included the 1994 Lexus SC, the Cadillac DeVille, and the BMW 3 Series. This same year, the introduction of the North American Free Trade Agreement changed the way that cars would be produced. Because of NAFTA, the United States was able to trade freely with Canada and Mexico; Mexico has since become a key player in automobile manufacturing.
1995
- Absolute gas price: $1.15
- Inflation-adjusted price: $2.06 (#4 least expensive year in 85-year span)
The '90s were a time of economic prosperity, job growth, and increased productivity that paved the way for a technological revolution. Although some of this growth was due to political strategy, many factors could be considered "lucky mistakes" or unpredictable. For instance, Clinton's effort to reduce the deficit shouldn't necessarily have helped with unemployment rates, but it did. The reduction of the deficit aided in bank recapitalization, which pumped up the economy and reduced unemployment as well.
1996
- Absolute gas price: $1.23
- Inflation-adjusted price: $2.14 (#8 least expensive year in 85-year span)
From 1995 to 1996, gas prices jumped substantially, and some cities hit prices far above the national average. Some pumps in New York City spiked as high as $1.56 per gallon. Analysts blamed the price hikes on the rising costs of crude oil, which hit $25 a barrel in the spring, forcing those who refined crude oil into gasoline to bump up their prices as well. Higher prices were also caused by higher national demand for gasoline, which some believe resulted from increases in speed limits across the country.
1997
- Absolute gas price: $1.23
- Inflation-adjusted price: $2.09 (#6 least expensive year in 85-year span)
In 1997, a one-day gas boycott brought down prices by 30 cents per gallon overnight—or at least, so says a 2012 Facebook post that received wide circulation as it called for a similar boycott. When officials from various agencies looked into this claim, however, they found no federal records or news archives in reference to a 1997 "gas out." In truth, gas prices remained fairly steady throughout 1997 and matched average prices of the year prior, save for changes in inflation.
1998
- Absolute gas price: $1.06
- Inflation-adjusted price: $1.78 (#1 least expensive year in 85-year span)
Gas prices fell substantially from 1997 to 1998, dropping from an average of $1.23 per gallon to just $1.06 per gallon, the lowest since the government began tracking gasoline prices. In some states, average costs fell below a dollar. These low prices were caused by the falling costs of crude oil, which was selling on the New York Mercantile Exchange for less than half of what it had been a year prior. While cheap gasoline is welcomed by consumers, the same can't be said for the oil industry. Some small oil producers were forced to shut down entirely, as bigger corporations faced layoffs and extreme cost-cutting measures.
1999
- Absolute gas price: $1.17
- Inflation-adjusted price: $1.92 (#2 least expensive year in 85-year span)
In 1998, gas prices hit an all-time low across the nation, and these prices continued into the early weeks and months of 1999. By the summer, prices were beginning to increase once again as oil production experienced cutbacks, but by the end of the year, absolute gas prices averaged $1.17 per gallon, climbing back toward the averages of years prior.
2000
- Absolute gas price: $1.51
- Inflation-adjusted price: $2.39 (#18 least expensive year in 85-year span)
The fears of Y2K were mostly unfounded—though some computer glitches related to formatting and calendar data did arise. In the world of gasoline, prices climbed once again, hitting $1.51 per gallon on average. Gas costs dropped off again near the end of the year, as OPEC decided to increase daily crude oil production, upping the daily output by 800,000 barrels.
2001
- Absolute gas price: $1.46
- Inflation-adjusted price: $2.25 (#12 least expensive year in 85-year span)
Gasoline prices dropped again from 2000 to 2001 during the first year of the Bush administration, amidst increased oil production from OPEC. In California, for example, gas prices dropped eight times over the course of nine weeks. They had risen during the spring, as usual, but continued to fall throughout the summer. In July, gas prices around the nation hit a three-month low of $1.40, though California taxes meant that the state's average price was $1.78.
2002
- Absolute gas price: $1.36
- Inflation-adjusted price: $2.06 (#5 least expensive year in 85-year span)
In 2002, gasoline prices fell for the second year in a row, both times by 10 cents or more. At this time, the National Academy of Sciences was feeling hopeful about the future of energy-efficient cars and released a study that estimated cars and trucks could meet a fuel efficiency level of 37 miles per gallon within the following 10 to 15 years. The same study also showed that falling prices weren't the only thing causing Americans to save money at the pump: the country was saving 2.7 barrels of gasoline every day as a result of increasingly more fuel-efficient vehicles.
2003
- Absolute gas price: $1.59
- Inflation-adjusted price: $2.36 (#17 least expensive year in 85-year span)
Only a few cars achieve true fame—Doc's DeLorean and the Batmobile may come to mind—but the Hummer H2 must be counted among the most infamous cars ever produced. The Hummer H2 was released for the 2003 model year, and with a curb weight of more than 6,000 pounds, it was not a subtle choice. The car was designed and originally produced in a time when gasoline prices were so low that filling up the behemoth's extra-large tank was possible with breaking the bank. In 2003, however, gasoline prices were on the rise, and would soon reach levels that made owning an H2 a rather unsavory option.
2004
- Absolute gas price: $1.88
- Inflation-adjusted price: $2.72 (#30 least expensive year in 85-year span)
In 2004, the United States was recovering from a recession that took place during 2002 and 2003. Fuel costs hit what was then an all-time high, reaching $1.88 per gallon on average. Multiple factors played into this price increase, among them a higher American fuel demand and consumption, and low domestic oil inventories. Additionally, OPEC's continued production cuts only served to hike gas prices further.
2005
- Absolute gas price: $2.30
- Inflation-adjusted price: $3.22 (#17 most expensive year in 85-year span)
Gas costs surged in 2005—as much at one point as 20 cents in a period of just three weeks—and crude oil prices continued to increase as well. In August, crude oil hit $67 a barrel, instigating concern over whether the world's oil supply would be able to keep up with an ever-growing demand for fuel.
2006
- Absolute gas price: $2.59
- Inflation-adjusted price: $3.51 (#11 most expensive year in 85-year span)
Crude oil and gasoline costs surged again in 2006, hitting an absolute price of $2.59 and an inflation-adjusted price of $3.20. At the same time, the Environmental Protection Agency was working to impose more stringent fuel restrictions, focusing specifically on combating sulfur levels in diesel fuel. Regulations demanding the use of low-sulfur diesel had been enacted in the '90s, but in 2006, the EPA began requiring ultra-low sulfur diesel, which contains only 15 parts per million.
2007
- Absolute gas price: $2.80
- Inflation-adjusted price: $3.69 (#8 most expensive year in 85-year span)
In 2007, oil prices rose once again, and at the end of the year had hit $90 per barrel. This caused gasoline prices to rise as well, with an increase of about 8% from the year prior. Though they ultimately continued to surge, costs dropped ever so slightly near the end of 2007, which experts attributed to the combination of lower gasoline demand during winter months, and consumers becoming disillusioned with steep numbers at the pump.
2008
- Absolute gas price: $3.27
- Inflation-adjusted price: $4.15 (#3 most expensive year in 85-year span)
Over the course of 2008, oil prices hit both historic highs and lows: From July to December, oil prices dropped from approximately $147 to $33 per barrel, all while nations around the globe felt the effects of the Great Recession. Oil prices directly impacted gasoline prices, which peaked this year at $3.27 before dropping substantially. The combination of falling income and rising gasoline prices also led to a large decrease in the sale of SUVs, which spelled huge financial trouble for the oil and automobile industries.
2009
- Absolute gas price: $2.35
- Inflation-adjusted price: $2.99 (#28 most expensive year in 85-year span)
By 2009, a combination of factors brought about the death of the Hummer as both a car and lifestyle brand. The previous year's high gasoline prices made the Hummer a very costly vehicle to drive, and attitudes toward SUVs were changing as citizens grappled with harsh environmental realities. With Hummer drivers experiencing increasing public shaming, Hummer sales dropped to 5,487 units for the year. Trouble was afoot elsewhere in the automotive industry: Both General Motors and Chrysler were hit so hard by the recession that they required government bailouts.
2010
- Absolute gas price: $2.79
- Inflation-adjusted price: $3.49 (#12 most expensive year in 85-year span)
Four years after "An Inconvenient Truth" detailed some of the potential lasting damage modern-scale fuel reliance could do, the automobile industry was getting in on the renewable energy game. In the wake of high gas prices, which would soon rise again, hybrid and electric vehicles began to hit the market. In 2010, the Department of Energy granted Tesla $465 million to develop electric cars at a California facility. That same year, Chevy released a plug-in hybrid, and Nissan released a 100% electric model called the LEAF.
2011
- Absolute gas price: $3.53
- Inflation-adjusted price: $4.28 (#2 most expensive year in 85-year span)
2011 was the first year in which average prices for both gasoline and diesel consistently stayed above $3 per gallon. These record highs can be attributed to inflated costs in the crude oil market, after the Obama administration and UN Security Council instigated a military intervention in Libya. Libya is one of the world's largest oil producers, and as a result, the nation's ability to produce and export oil was disrupted, causing price shocks throughout the global oil market.
2012
- Absolute gas price: $3.64
- Inflation-adjusted price: $4.33 (#1 most expensive year in 85-year span)
In 2012, the national average price of gasoline was up $0.09 to a new high of $3.64 per gallon. The American Automobile Association offered a number of reasons for prices continuing to climb, including the devastating impact of Hurricane Sandy, among other costly storms, as well as continued tensions in the Middle East. Analysts noted, however, that despite high prices at gas stations, Americans were not necessarily spending more on gasoline overall, due to a large dip in total demand for the product.
2013
- Absolute gas price: $3.53
- Inflation-adjusted price: $4.14 (#6 most expensive year in 85-year span)
After several years of dramatic jumps, gasoline prices fell slightly in 2013 to the same absolute price as 2011. A key reason for this movement toward lower prices was an increase in domestic oil production within the United States. In October of 2013, America produced more oil domestically than it imported from other nations. The United States had not produced more than it imported in nearly two decades, and this milestone came with an additional marker: The country had not imported so little crude oil since 1991.
2014
- Absolute gas price: $3.37
- Inflation-adjusted price: $3.89 (#7 most expensive year in 85-year span)
The average cost of gas in 2014 ultimately fell lower than it did in 2013, but not without a few sharp peaks along the way. In April, a time when gas prices tend to spike, the average price per gallon across the nation was $3.70, higher than it had been during the same month the previous year. The conflict in Iraq was a cause of these high prices, as the Islamic State group seizing control of much of the country led to a disruption of Iraq's oil supply. After these summer spikes, many states would begin to see prices flatten or fall leading into the next year.
2015
- Absolute gas price: $2.45
- Inflation-adjusted price: $2.82 (#37 least expensive year in 85-year span)
By September of 2016, gas prices had fallen so much that only four states (California, Nevada, Alaska, and Hawaii) maintained an average cost above $3 a gallon; in some states, the average gas price fell below $2. The falling prices can be partially attributed to the United States' rising domestic production, which typically would cause OPEC to limit its own production in order to drive up global oil demand. However, Saudi Arabia, the leader of OPEC, showed no signs of slowing and continued to export oil at its normal capacity, leading to a glut in the market and low prices at the pump.
2016
- Absolute gas price: $2.14
- Inflation-adjusted price: $2.43 (#21 least expensive year in 85-year span)
Gasoline prices continued to fall throughout 2015 and 2016, which, for most drivers, was only happy news. In fact, government officials estimated that the low cost of gas the previous year had saved drivers $100 billion. Some analysts pointed out that extremely low oil prices, leading to low gas prices, may be linked to concerning global trends, like slow growth in economic powerhouses like China. For the time being, however, consumers were happy with full tanks. The car industry saw its best year in a long time, with nearly 18 million units sold.
2017
- Absolute gas price: $2.41
- Inflation-adjusted price: $2.68 (#29 least expensive year in 85-year span)
Crude oil makes up about half the price of a gallon of gas, so as crude oil prices began to creep back up in 2017, gasoline prices followed suit. Summer is typically a time for gas prices to rise, and the summer of 2017 was no different. This time, however, price hikes were due not just to the usual increase in demand, but to the catastrophic effects of Hurricane Harvey, which hit the coast of Texas in August and caused more than $120 billion in damage. Texas is a key source of American oil, and the hurricane-damaged oil refineries and crucial infrastructure, causing a rise in gasoline prices.
2018
- Absolute gas price: $2.74
- Inflation-adjusted price: $2.98 (#29 most expensive year in 85-year span)
Many Americans may expect to spend a little extra around Thanksgiving, but in 2018, higher than usual November gas prices meant that the holiday commute to your in-laws may have been even pricier. While these November pump prices were up 4 cents from the year prior, experts in the oil and gas industry noted that it was still a time of relatively low prices. They connected this to OPEC's 2014 decision not to institute production cuts, causing oil and gasoline prices around the world to fall.
2019
- Absolute gas price: $2.64
- Inflation-adjusted price: $2.82 (#36 least expensive year in 85-year span)
The trade war between the U.S. and China represented the biggest precipitator of decreasing prices in 2019. As concerns grew and investors bet on an economic downturn, according to a June 2019 New York Times article, crude oil prices dropped over 20% from their April peak. The article also cites a AAA report that gasoline prices followed suit, as is typically the case, and also fell—exceeding a 7% change from 2018. Forbes' Robert Rapier reported in August that the price of crude oil dropped the most in more than four years.
2020
- Absolute gas price: $2.17
- Inflation-adjusted price: $2.29 (#15 least expensive year in 85-year span)
In April 2020, U.S. crude oil futures for May reached a record low of minus $37.63, representing a nearly 300% drop and the biggest valuations falloff in history. The COVID-19 pandemic and concurrent shutdowns resulted in drastic changes to how people consumed gas, with fewer greenhouse gas emissions as a result.
2021
- Absolute gas price: $2.83
- Inflation-adjusted price: $2.83 (#38 least expensive year in 85-year span)
Gas prices rose significantly in 2021, with the average price for a gallon of gasoline at $3.16 in August of that year, up from $2.19 at the same time in 2020. The dramatic swing came largely from all-time low demand during the coronavirus pandemic.


