Reading and math proficiency are at historic lows. Here's a closer look at who's falling behind
This story originally appeared on HeyTutor and was produced and distributed in partnership with Stacker Studio.
Reading and math proficiency are at historic lows. Here's a closer look at who's falling behind
Concerns about the state of U.S. education have been discussed in communities across the country for decades, and the COVID-19 pandemic only thrust these conversations—and their urgency–further into the spotlight. A shift to at-home learning combined with other problems such as teacher shortages and a fraught political landscape have affected students' basic proficiencies—and it is showing in test scores.
Each year, the National Assessment of Educational Progress releases information about reading and math assessments to paint a picture of the overall health of U.S. education by grade level. Among other subjects, the NAEP report card shares scores in reading and mathematics, two key subjects representing progress. Scores are released for students in grades 4, 8, and 12, depending on the year.
HeyTutor analyzed the 2022 National Assessment of Educational Progress from the Department of Education's National Center for Education Statistics to see how different groups of students have fared in their reading and math assessments over the past 20 years.
Educational gains have mostly been eroding since 2020
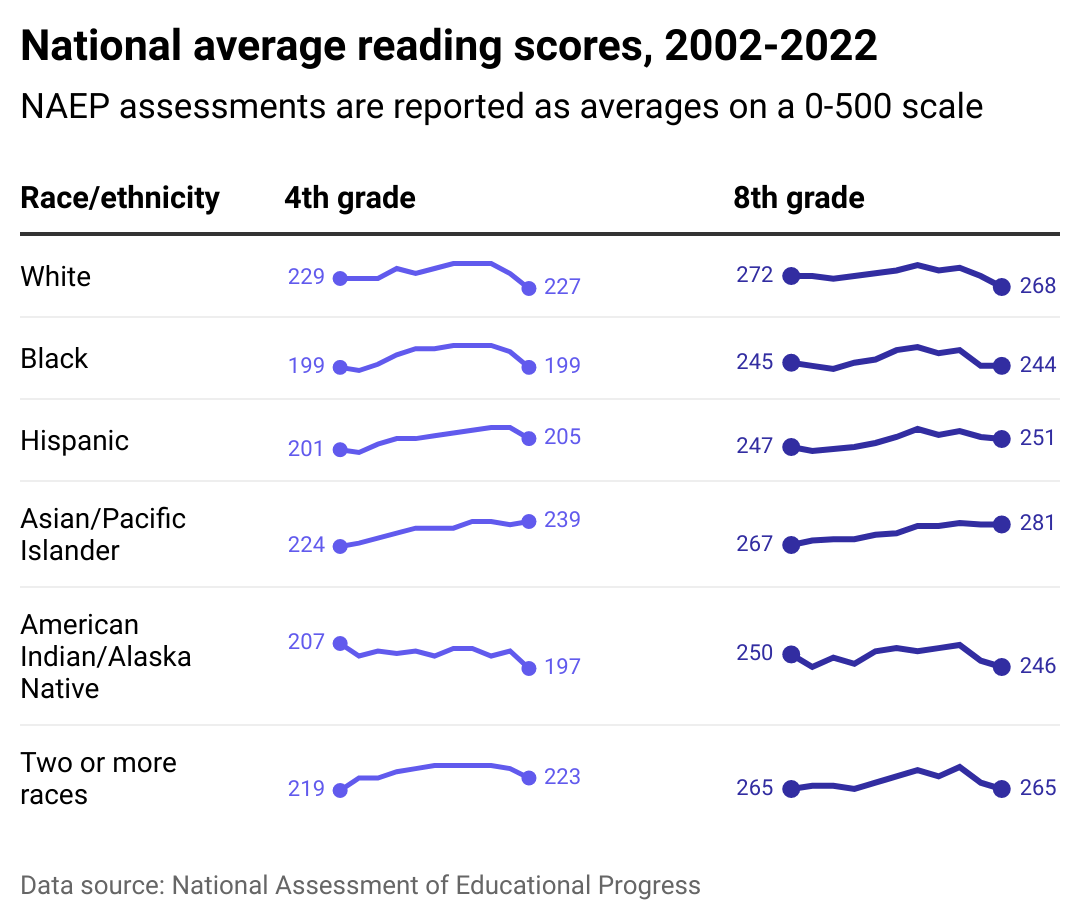
The national average for reading scores, primarily in the early-to-mid-2010s, saw increases over the previous 10 years, but those gains began to fall off at the start of the pandemic in 2020, with most average scores now at or below where they were in 2002. The data varies significantly by students' race—white, Black, and American Indian/Alaska Native showed the most marked decline, while there has actually been an increase in reading scores among Asian and Pacific Islander children.
Perhaps more telling in terms of overall reading comprehension are these averages compared with the minimum scores for basic achievement—for 4th-grade reading, the minimum is 208; for 8th grade, it is 243. Black, Hispanic, and American Indian/Alaska Native 4th graders all failed to meet this benchmark, though each group rallied to crest the 8th-grade minimum, but by a very slim margin. White students at both grade levels only average approximately 20-25 points over the minimum. Given the fact that the scoring scale runs to 500, general reading comprehension levels, certainly post-pandemic, are barely reaching the 50th percentile.
The post-COVID-19-outbreak falloff hasn't affected all kids equally
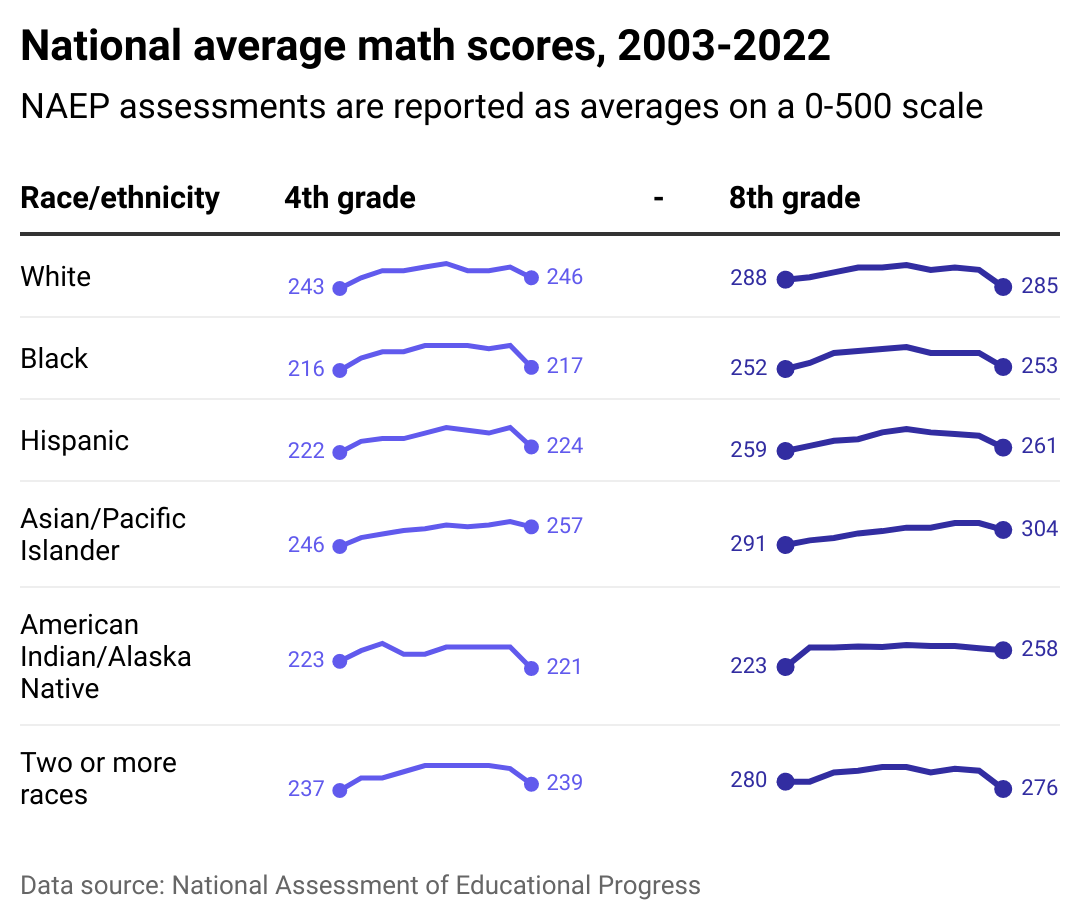
While similar trends in reading and math scores among all students are apparent, different racial and ethnic groups have had drastically different starting points.
White and Asian students and students of two or more races have consistently tracked higher scores than Black or Hispanic students, for example. Thus those groups' average scores as of 2022 are commensurately higher.
While a recent drop in reading and math proficiency is evident across racial lines, it will still be imperative to address educational inequities to make consistent improvements across the entire U.S. student population. Students from minority communities are at greater risk from falling scores, as they might not only see steeper declines, but also test at a consistently lower level than their white counterparts.
The pandemic-era dip in average eighth-grade scores across all groups is particularly concerning, according to Commissioner of the National Center for Education Statistics Peggy Carr. She told the New York Times, "[Eighth] grade is that gateway to more advanced mathematical course taking."
Poverty continues to have one of the largest effects on test scores
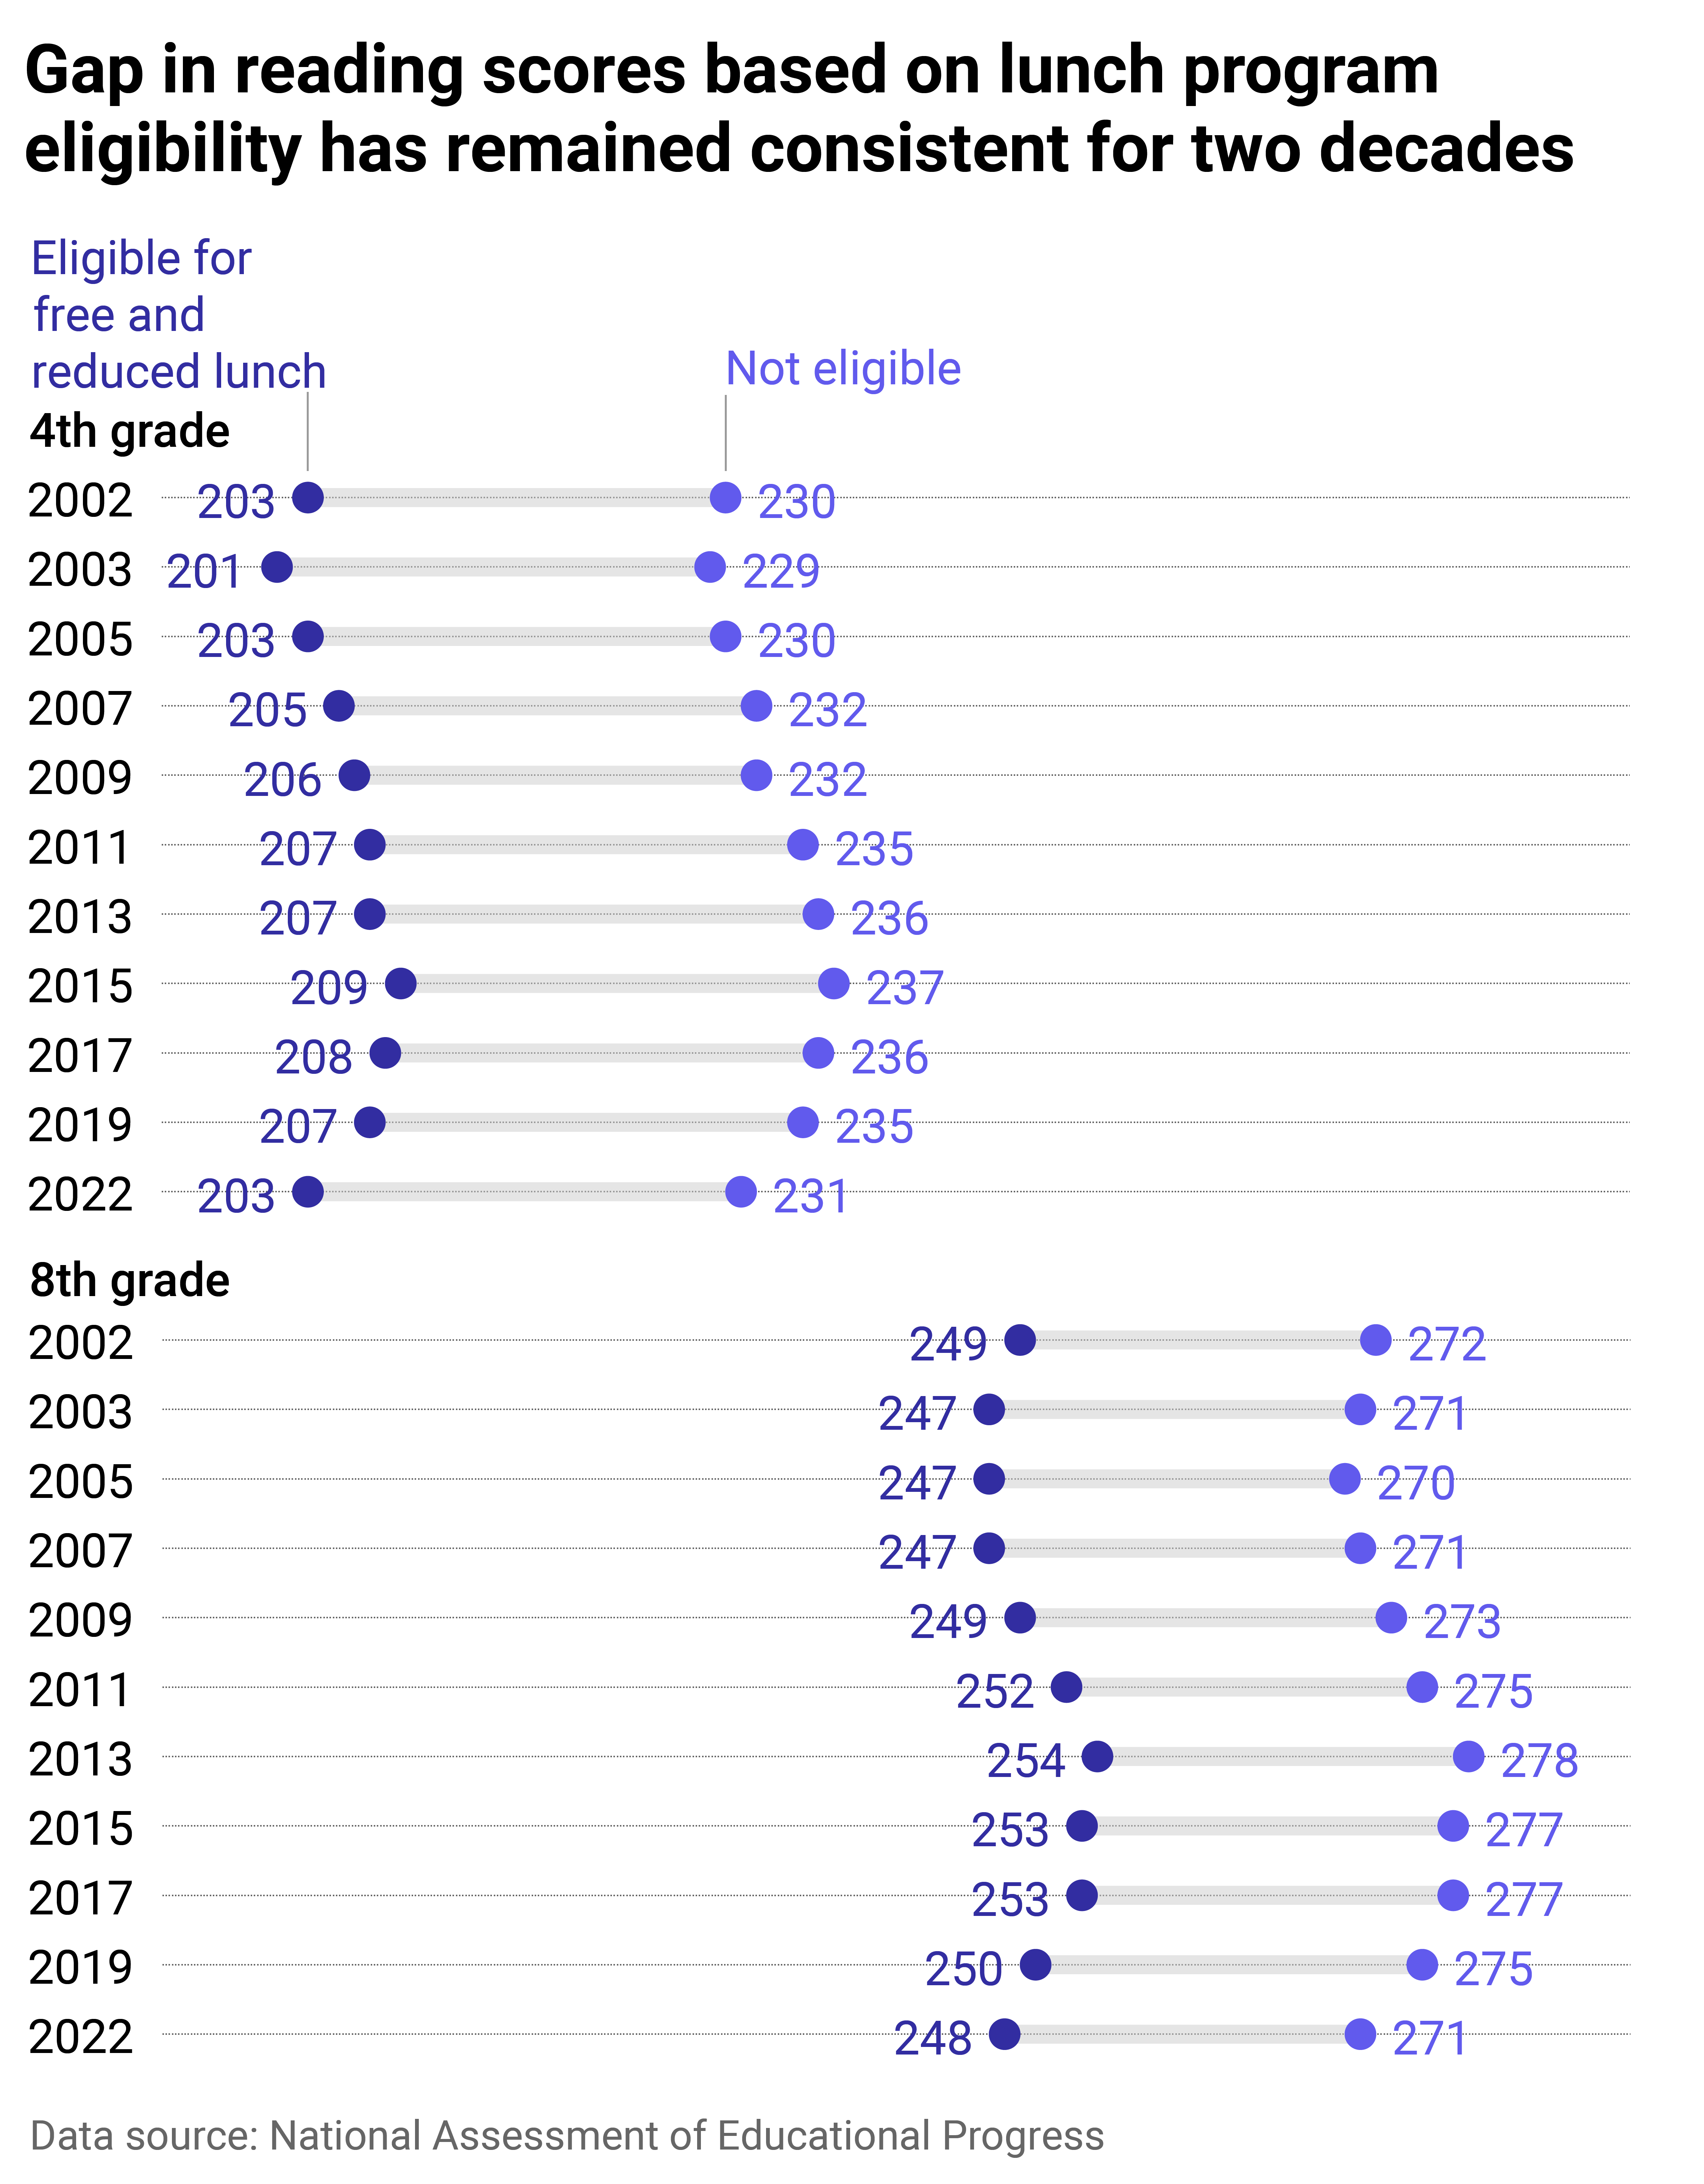
Poverty is particularly impactful regarding socioeconomic factors contributing to the gap in education scores. When assessing the poverty level of school children, one of the markers used as qualification is participation in the National School Lunch Program.
This federally assisted program provides meals to millions of food-insecure children each year; eligibility for the program depends on household income levels. Since 2002, there has been a consistent divide of around 30 points in both reading and math scores between those who are eligible for school lunch programs and those who are not.
According to the Census Bureau's Survey of Income and Program Participation, more than 33 million children received school meals through the NSLP in 2019, and just over 21 million received free school lunches. The NSLP was a key aspect of the national "safety net" aiding in-need children throughout the pandemic, despite school closures and other in-person learning restrictions.
Despite the expanded eligibility for NSLP participation during the first two years of the pandemic and a resulting decline in food insecurity among school children, the disparity in test scores between those above and below the poverty line remained. To that end, research suggests that federal pandemic aid, though robust, was simply not enough to mitigate learning loss.
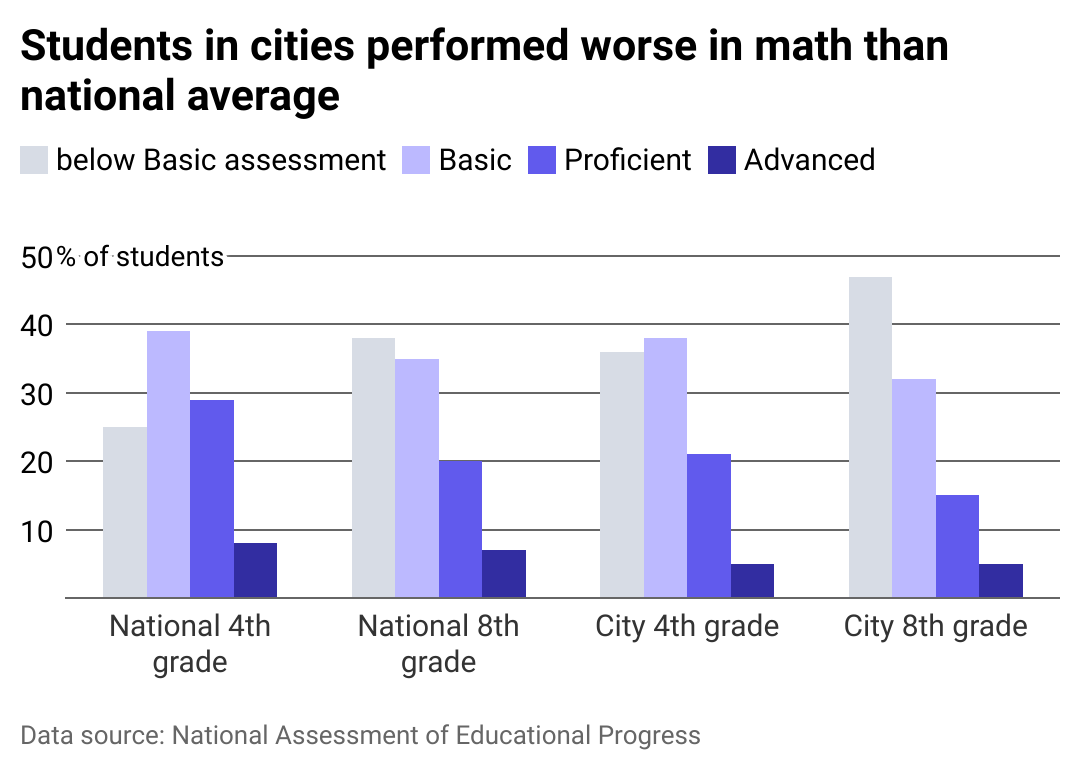
Large cities trend slightly lower than national trends
Large cities are faring consistently worse than the nation as a whole, according to NAEP data. This fact is unsurprising when one considers the downward trends among racial and ethnic groups, particularly Black and Hispanic students, as populations in large cities tend to be larger and more racially diverse.
Large urban public schools are not immune from poverty among their students nor from the national teacher shortage affecting all corners of the educational system. Research from the Council of the Great City Schools found that in large city schools, there is a 50% higher probability of students being poor.
As poverty has been linked to poorer testing among children, it makes sense that big-city schools bear a greater brunt regarding the number of children with learning gaps. With teacher shortages approaching crisis levels, the impact on big-city schools is also higher due to the larger class sizes typical in these areas.


