Transportation is the largest source of carbon emissions in the US. Here's how it breaks down by state
This story originally appeared on Velotric and was produced and distributed in partnership with Stacker Studio.
Transportation is the largest source of carbon emissions in the US. Here's how it breaks down by state
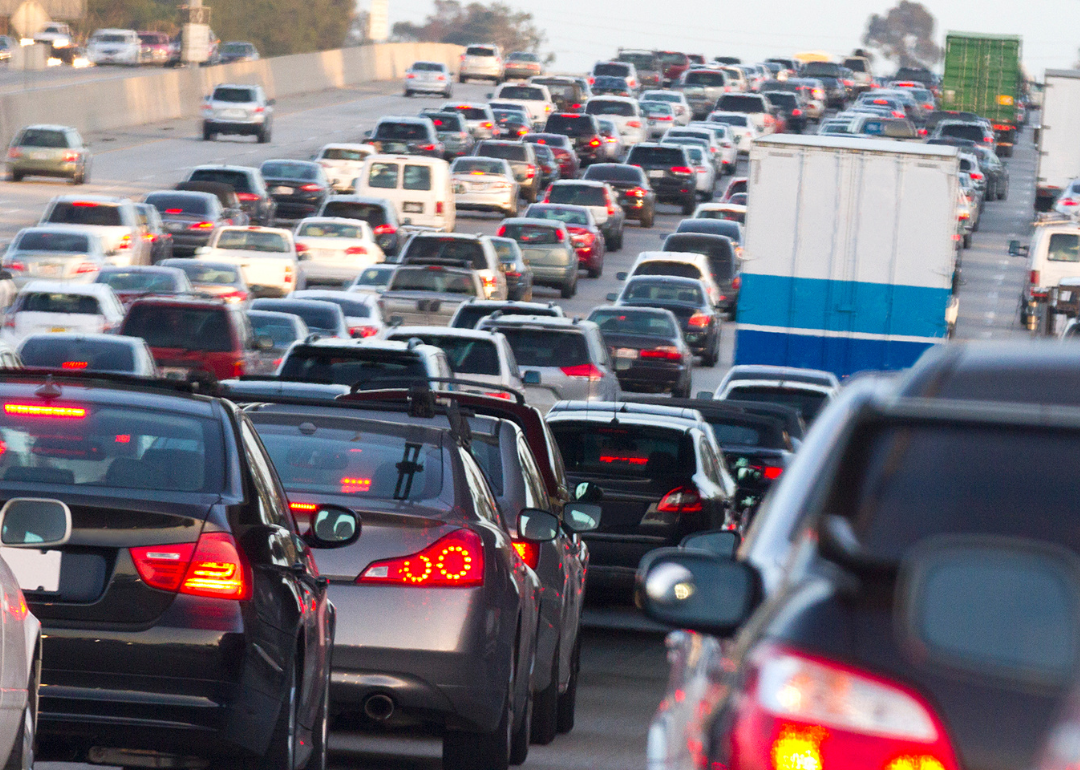
The United States is historically, and often proudly, a nation of cars. This perhaps relates to the country's strong ethos of independence and the symbolic (as well as practical) role automobiles have played in this sense of personal freedom. Whereas extensive public transportation is regarded as a public imperative in nations throughout Europe, America prides itself on being behind the wheel, both literally and metaphorically.
Therefore, it is,unsurprising that transportation is the country's largest source of CO2 emissions. In 2020, this sector accounted for 27% of total greenhouse gas emissions nationwide, amounting to around 1.6 billion metric tons, more than the agriculture, residential, and commercial sectors combined. This figure accounts for fossil fuels burned by all forms of transportation—cars, trucks, ships, trains, and airplanes. These emissions have long-lasting effects beyond eroding the earth's atmosphere and contributing to climate change. For instance, transportation emissions are responsible for over 55% of nitrogen oxides released into the air, a major component of smog and air pollution.
However, the good news is that the American transportation industry can steer its long-standing tradition of innovation toward environmentally conscious systems. In the past years, strides have been made in expanding public transportation systems, multimodal infrastructure, and accessibility of electric vehicles—not just electric cars and trucks, but e-bikes and scooters. One school district in Maryland, for example, recently introduced the largest fleet of electric school buses to hit the road, and multiple states are factoring in parking spaces, multiuse roads, and pedestrian navigation support to make cities more inclusive of various modes of transportation.
Citing data from the Energy Information Administration and the Environmental Protection Agency, Velotric visualized transportation emissions in the U.S. and how it varies by state.
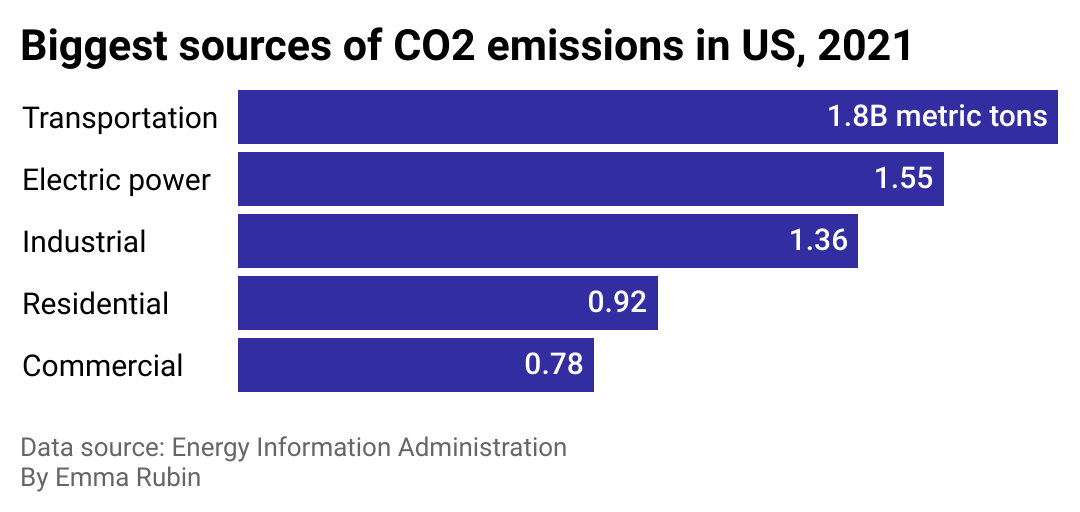
How transportation emissions compare to other sectors
Transportation eclipses other sources of CO2 emissions, largely because there are few alternatives for power—over 90% of the fuel for vehicles is petroleum-based. CO2 emissions from the transportation sector increased by an estimated 200 million metric tons from 2020 to 2021.
The second-closest emissions generator—electricity—accounted for approximately one-quarter of greenhouse gas emissions in 2020 and 2021. While CO2 emissions from electricity generation have sharply declined since 1990, 60% of electricity production remains the result of burning coal and other fossil fuels.
Industrial, commercial, and residential sources of carbon emissions encompass everything from heat production to waste elimination. Finally, agriculture and forestry are also high-ranking sources of CO2, largely the result of livestock farming and carbon sinks.
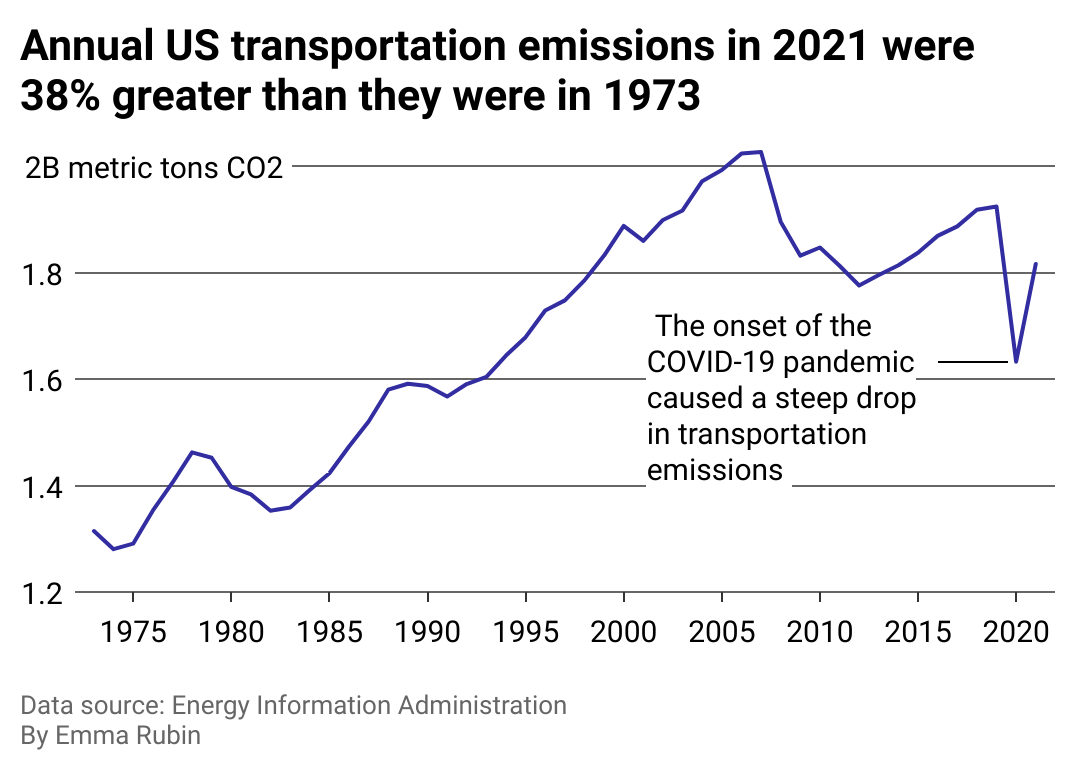
Transportation emissions approached pre-pandemic levels in 2021
The COVID-19 pandemic caused a record-breaking reduction in transportation-sourced carbon emissions in 2020, but unfortunately, this was only temporary. In 2021, Americans began to return to the road and air as lockdowns eased and businesses reopened, and emission levels rose to nearly pre-pandemic rates. After a 15% decrease in 2020, transportation emissions grew by more than 10% the following year. Much of this was the result of truck transport, as the pandemic saw a spike in online shopping and a resulting cross-country delivery of goods.
On a global scale, transportation emissions were 600 megatons lower than 2019 levels, and the global aviation sector saw CO2 release equivalent to just 60% of its pre-pandemic levels.
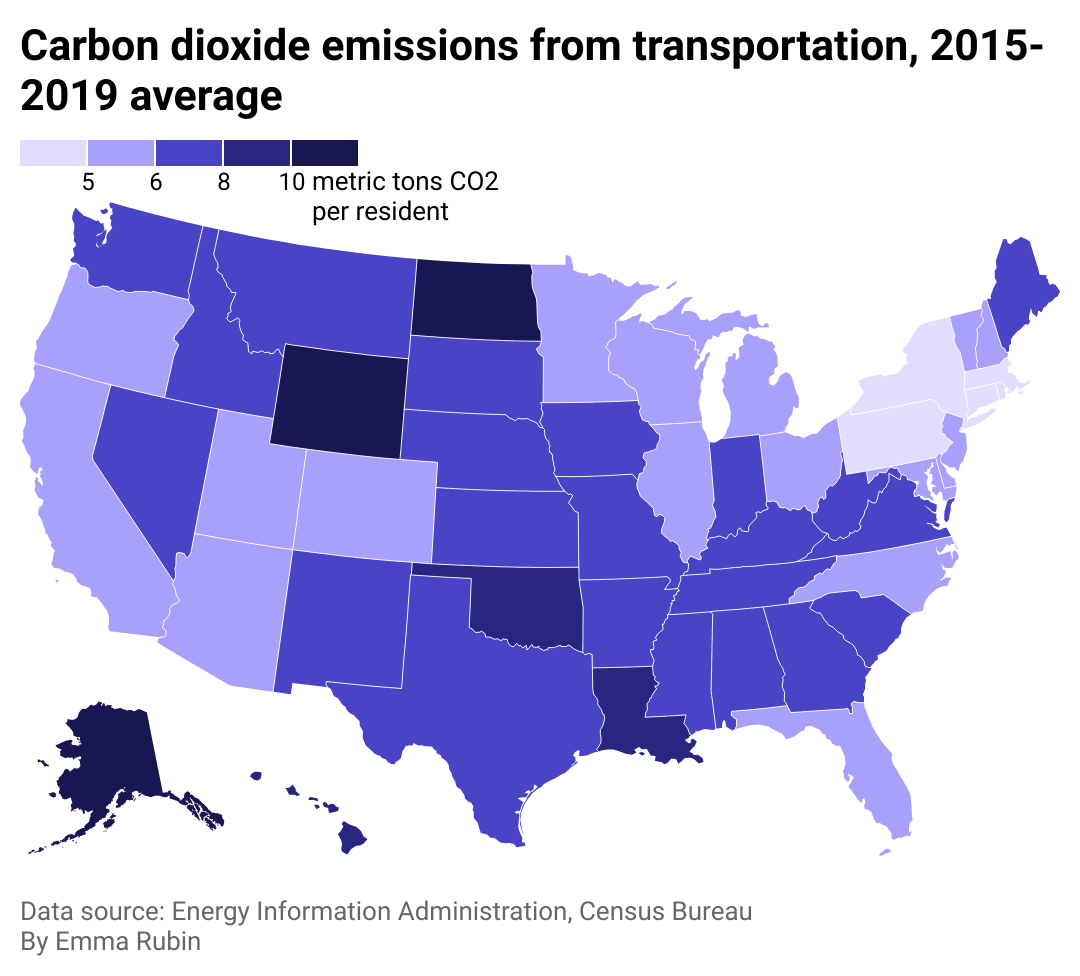
Alaska has the most transportation emissions per capita
With 15.66 metric tons of CO2 per resident, Alaska tops state-by-state rates for emissions per capita, followed closely by Wyoming (13.34 metric tons per resident) and North Dakota (11.94). Hawaii (8.34) and Louisiana (8.34) round out the top five. At the opposite end, Pennsylvania (4.77), Massachusetts (4.62), Connecticut (4.30), New York (4.10), Rhode Island (3.69), and Washington D.C. (1.57) have the lowest emissions per capita.
In general, population-dense states with more urban areas tend to have more comprehensive public transportation systems, reducing overall transportation emissions. In contrast, sparsely populated states tend to rely on fossil fuels for both individual vehicle use and bigger industrial operations.
In remote and sporadically settled Alaska, transportation is largely car-based, with public transit primarily isolated to the major cities of Juneau, Anchorage, Fairbanks, and Matanuska-Susitna. Infrastructure in Alaska largely encourages an individual, heavily fuel-based culture, with many citizens even relying on small planes to travel from town to town.
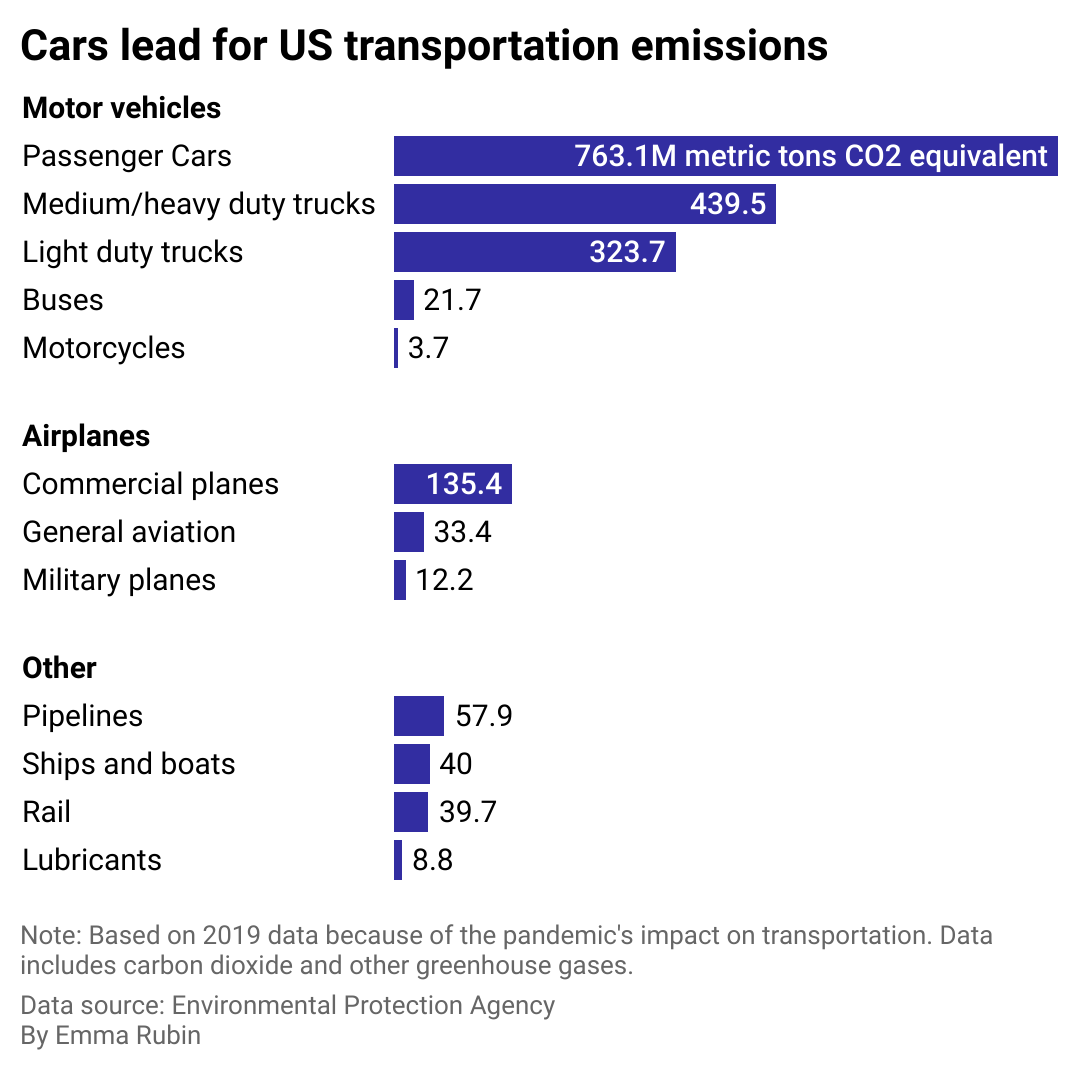
Personal vehicles drive transportation emissions
America has constructed itself around the car in both infrastructure and cultural attitudes. According to a global consumer survey cited by the World Economic Forum, 76% of Americans drive themselves to work in personal vehicles, often without carpooling. Even for small errands and trips, Americans often use bulky, fuel-inefficient vehicles unnecessarily. From 2012 to 2021, sales of every category of midsize or large SUVs and trucks grew by more than 20%. Personal cars, SUVs, and trucks account for around 66% of transportation-based emissions in the country.
Conversely, the significant reduction in GHG release associated with public transportation has been a well-known fact for many years. In a 2010 report, the Federal Transit Administration found that public transportation systems produces 76% less greenhouse gas emissions per passenger mile than a single-occupancy vehicle. In both public and private mass transport, the more passengers, the fewer fossil fuels are wasted. For instance, a bus with 28% of its seats occupied emits one-third less per passenger mile than the average single-occupancy vehicle; when the number of seats taken on the bus increases to 100%, it saves 82% of emissions compared to a private car.


