
States with the most conservatives
With a few rare exceptions, one thing is all but certain in American elections: the winner will be a Republican or a Democrat. America's two-party system is characterized by a liberal-conservative split that forces even moderates to pick a side. In many cases, the side you pick has a lot to do with where you live. According to The New York Times, America has spent the last few decades "self-segregating" into "blue" (liberal-leaning) states and "red" (conservative-leaning) states. With the White House, both houses of Congress and most state houses firmly in its grasp, Red America is currently exercising the most political influence. So where do the conservatives who dominate America's modern government live?
Stacker used data from Gallup to rank all 50 states by the percent of conservative residents, then by the percent of residents who are Republican-leaning. In the event that two states had the same percent, the state ranking is denoted as tied.
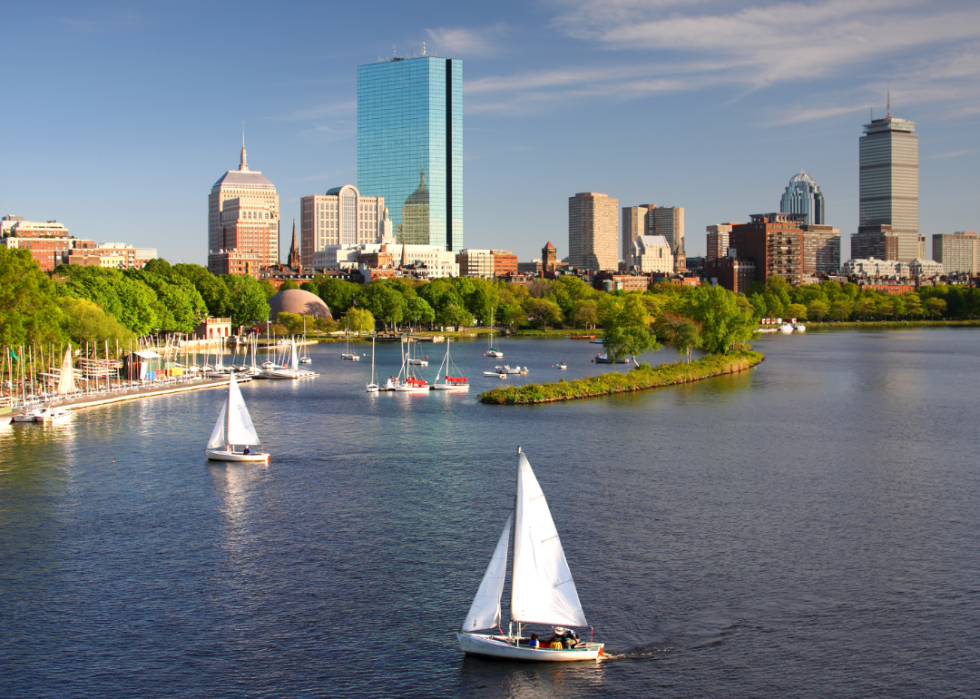
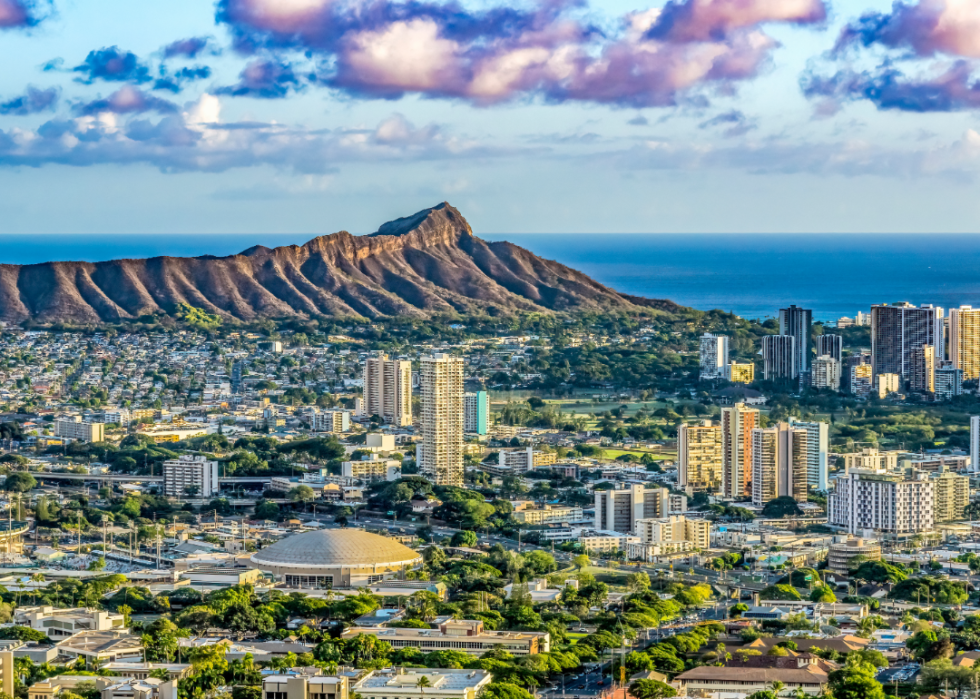
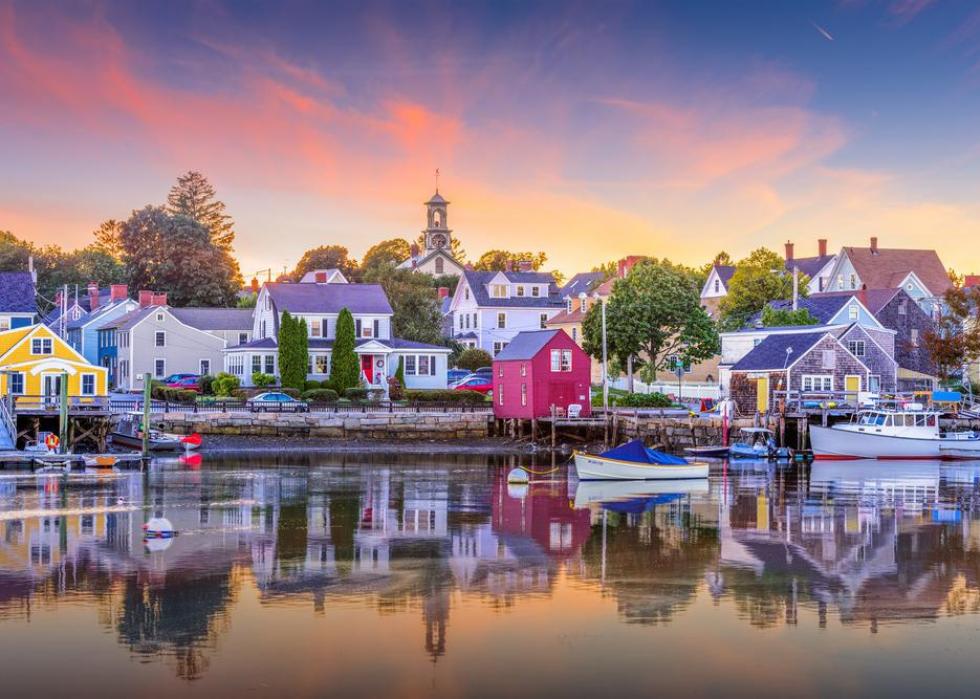
It might not come as a surprise that the states with the lowest concentrations of conservatives are on the West Coast, in the Northeast, and in New England. Sparsely populated rural states and Southern states dominated the list of those with the most conservatives. Just two states count at least 50% of their populations as Republican-leaning. In total, the national percentage of conservatives is 33%, and the national percentage of Republican-leaning residents is 38%.

#50. Massachusetts
Estimated state population in 2017: 6,859,819
Percent of state residents who are conservative: 22%
Percent of state residents who are Republican-leaning: 26%

#49. Rhode Island
Estimated state population in 2017: 1,059,639
Percent of state residents who are conservative: 24%
Percent of state residents who are Republican-leaning: 27%

#48. Hawaii
Estimated state population in 2017: 1,427,538
Percent of state residents who are conservative: 25%
Percent of state residents who are Republican-leaning: 28%

#47. Vermont
Estimated state population in 2017: 623,657
Percent of state residents who are conservative: 25%
Percent of state residents who are Republican-leaning: 30%

#46. New York
Estimated state population in 2017: 19,849,399
Percent of state residents who are conservative: 27%
Percent of state residents who are Republican-leaning: 29%

#45. California
Estimated state population in 2017: 39,536,653
Percent of state residents who are conservative: 27%
Percent of state residents who are Republican-leaning: 30%

#44. Maryland
Estimated state population in 2017: 6,052,177
Percent of state residents who are conservative: 28%
Percent of state residents who are Republican-leaning: 28%

#43. Connecticut
Estimated state population in 2017: 3,588,184
Percent of state residents who are conservative: 28%
Percent of state residents who are Republican-leaning: 32%

#41 (tie). Delaware
Estimated state population in 2017: 961,939
Percent of state residents who are conservative: 28%
Percent of state residents who are Republican-leaning: 33%

#41 (tie). New Jersey
Estimated state population in 2017: 9,005,644
Percent of state residents who are conservative: 28%
Percent of state residents who are Republican-leaning: 33%

#40. Oregon
Estimated state population in 2017: 4,142,776
Percent of state residents who are conservative: 28%
Percent of state residents who are Republican-leaning: 36%

#39. Washington
Estimated state population in 2017: 7,405,743
Percent of state residents who are conservative: 29%
Percent of state residents who are Republican-leaning: 34%

#38. Illinois
Estimated state population in 2017: 12,802,023
Percent of state residents who are conservative: 30%
Percent of state residents who are Republican-leaning: 33%
#37. Colorado
Estimated state population in 2017: 5,607,154
Percent of state residents who are conservative: 30%
Percent of state residents who are Republican-leaning: 37%

#36. New Hampshire
Estimated state population in 2017: 1,342,795
Percent of state residents who are conservative: 31%
Percent of state residents who are Republican-leaning: 40%

#35. New Mexico
Estimated state population in 2017: 2,088,070
Percent of state residents who are conservative: 32%
Percent of state residents who are Republican-leaning: 34%

#34. Minnesota
Estimated state population in 2017: 5,576,606
Percent of state residents who are conservative: 32%
Percent of state residents who are Republican-leaning: 37%

#33. Virginia
Estimated state population in 2017: 8,470,020
Percent of state residents who are conservative: 33%
Percent of state residents who are Republican-leaning: 38%

#32. Nevada
Estimated state population in 2017: 2,998,039
Percent of state residents who are conservative: 33%
Percent of state residents who are Republican-leaning: 39%

#31. Arizona
Estimated state population in 2017: 7,016,270
Percent of state residents who are conservative: 33%
Percent of state residents who are Republican-leaning: 42%

#30. Michigan
Estimated state population in 2017: 9,962,311
Percent of state residents who are conservative: 34%
Percent of state residents who are Republican-leaning: 38%

#29. Maine
Estimated state population in 2017: 1,335,907
Percent of state residents who are conservative: 34%
Percent of state residents who are Republican-leaning: 39%

#28. Pennsylvania
Estimated state population in 2017: 12,805,537
Percent of state residents who are conservative: 34%
Percent of state residents who are Republican-leaning: 41%

#27. Florida
Estimated state population in 2017: 20,984,400
Percent of state residents who are conservative: 35%
Percent of state residents who are Republican-leaning: 39%

#26. Wisconsin
Estimated state population in 2017: 5,795,483
Percent of state residents who are conservative: 35%
Percent of state residents who are Republican-leaning: 41%

#25. Ohio
Estimated state population in 2017: 11,658,609
Percent of state residents who are conservative: 35%
Percent of state residents who are Republican-leaning: 42%

#24. North Carolina
Estimated state population in 2017: 10,273,419
Percent of state residents who are conservative: 36%
Percent of state residents who are Republican-leaning: 39%
#23. Georgia
Estimated state population in 2017: 10,429,379
Percent of state residents who are conservative: 36%
Percent of state residents who are Republican-leaning: 40%

#22. Indiana
Estimated state population in 2017: 6,666,818
Percent of state residents who are conservative: 36%
Percent of state residents who are Republican-leaning: 43%

#21. Alaska
Estimated state population in 2017: 739,795
Percent of state residents who are conservative: 36%
Percent of state residents who are Republican-leaning: 52%

#20. Iowa
Estimated state population in 2017: 3,145,711
Percent of state residents who are conservative: 37%
Percent of state residents who are Republican-leaning: 42%

#19. Texas
Estimated state population in 2017: 28,304,596
Percent of state residents who are conservative: 38%
Percent of state residents who are Republican-leaning: 41%

#18. West Virginia
Estimated state population in 2017: 1,815,857
Percent of state residents who are conservative: 38%
Percent of state residents who are Republican-leaning: 44%

#17. Missouri
Estimated state population in 2017: 6,113,532
Percent of state residents who are conservative: 38%
Percent of state residents who are Republican-leaning: 45%

#16. Kansas
Estimated state population in 2017: 2,913,123
Percent of state residents who are conservative: 38%
Percent of state residents who are Republican-leaning: 48%
#15. Kentucky
Estimated state population in 2017: 4,454,189
Percent of state residents who are conservative: 39%
Percent of state residents who are Republican-leaning: 45%

#14. North Dakota
Estimated state population in 2017: 755,393
Percent of state residents who are conservative: 39%
Percent of state residents who are Republican-leaning: 56%

#13. Louisiana
Estimated state population in 2017: 4,684,333
Percent of state residents who are conservative: 40%
Percent of state residents who are Republican-leaning: 43%

#12. Tennessee
Estimated state population in 2017: 6,715,984
Percent of state residents who are conservative: 40%
Percent of state residents who are Republican-leaning: 47%

#11. South Carolina
Estimated state population in 2017: 5,024,369
Percent of state residents who are conservative: 41%
Percent of state residents who are Republican-leaning: 47%

#10. Nebraska
Estimated state population in 2017: 1,920,076
Percent of state residents who are conservative: 41%
Percent of state residents who are Republican-leaning: 50%

#9. South Dakota
Estimated state population in 2017: 869,666
Percent of state residents who are conservative: 41%
Percent of state residents who are Republican-leaning: 52%

#8. Arkansas
Estimated state population in 2017: 3,004,279
Percent of state residents who are conservative: 42%
Percent of state residents who are Republican-leaning: 45%

#7. Oklahoma
Estimated state population in 2017: 3,930,864
Percent of state residents who are conservative: 42%
Percent of state residents who are Republican-leaning: 49%

#6. Montana
Estimated state population in 2017: 1,050,493
Percent of state residents who are conservative: 42%
Percent of state residents who are Republican-leaning: 51%

#5. Idaho
Estimated state population in 2017: 1,716,943
Percent of state residents who are conservative: 42%
Percent of state residents who are Republican-leaning: 53%

#4. Utah
Estimated state population in 2017: 3,101,833
Percent of state residents who are conservative: 42%
Percent of state residents who are Republican-leaning: 56%

#3. Mississippi
Estimated state population in 2017: 2,984,100
Percent of state residents who are conservative: 43%
Percent of state residents who are Republican-leaning: 45%

#2. Alabama
Estimated state population in 2017: 4,874,747
Percent of state residents who are conservative: 43%
Percent of state residents who are Republican-leaning: 50%

#1. Wyoming
Estimated state population in 2017: 579,315
Percent of state residents who are conservative: 46%
Percent of state residents who are Republican-leaning: 56%